
The New Zealand property market is still settling into its current phase — as reflected by volatility across the regions, with a 31.6% annual price increase in one region and a 5.0% decrease in another, REINZ Chief Executive Jen Baird says


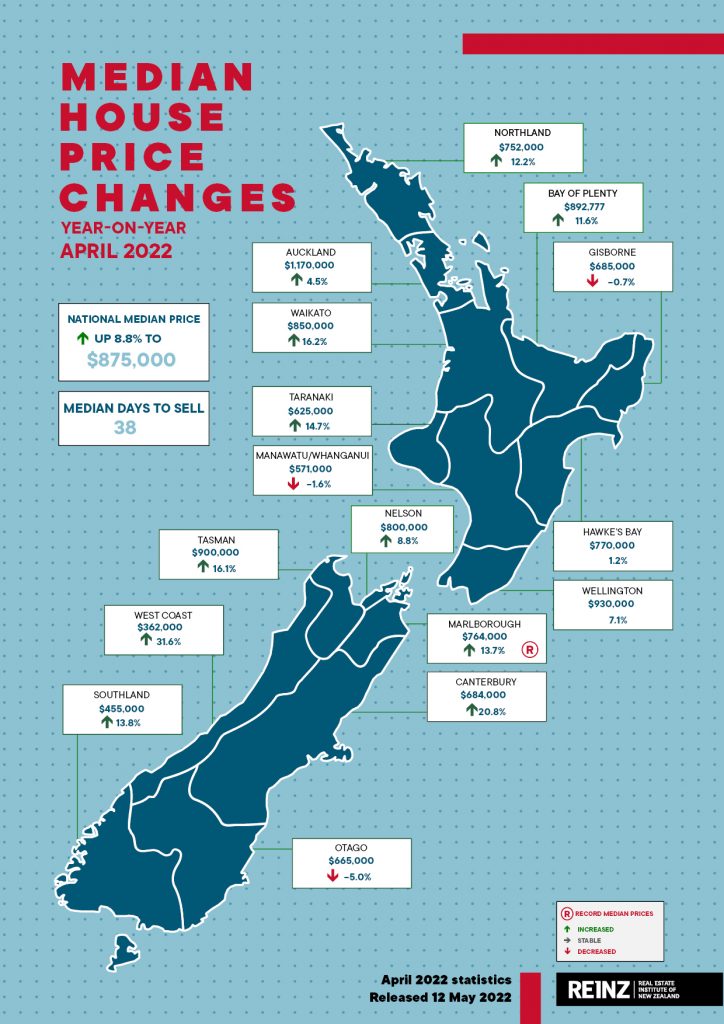
Across New Zealand, median prices for residential property increased 8.8% annually, from $804,362 in April 2021 to $875,000 in April 2022. While the nominal median property price decreased 1.7% month-on-month, the seasonally adjusted figures show a 2.4% increase.
The median residential property price for New Zealand excluding Auckland increased 9.9% annually from $687,200 in April 2021 to $755,000 in April 2022 — down 2.4% month-on-month. In Auckland, the median property price increased 4.5% annually from $1,120,000 to $1,170,000 — down 2.5% month-on-month.
Overall, median prices have fallen. However, median prices show volatility by region.
On one end of the spectrum, the West Coast saw the median property price increase 31.6% annually — from $275,000 to $362,000 in April 2022 — and Canterbury saw a 20.8% increase in median prices — from $566,000 to $684,000.
On the other end, three regions saw an annual median price decrease — the last time three regions showed an annual decrease was in April 2020, and before that it was September 2019. The median property price in Otago was down 5.0% — from $700,000 in April 2021 to $665,000 April 2022, Manawatu/Whanganui saw a decrease of 1.6% — from $580,000 to $571,000, and Gisborne was down 0.7% — from $690,000 to $685,000.
Marlborough was the only region to reach a new record median price this month of $764,000 — up 13.7% on the same time last year. Four territorial authorities (TAs) achieved record medians, the lowest number of TA records since October 2015. More information on activity by region and TA record median prices can be found in the regional commentaries in the REINZ Monthly Property Report.
There is a lot more property on the market and combined with a less positive financial and economic outlook, we are seeing demand dissipate — alleviating upward pressure and moderating price growth.
While West Coast and Canterbury saw annual increases of 31.6% and 20.8% respectively, looking at the month-on-month figures, it’s clear the median property price is falling. However, drawing on historical data, we know prices tend to be more sticky when trending down that when increasing.
Fear of overpaying has overtaken fear of missing out, as potential buyers take the time to consider the financial environment and their increased options on the market.
Despite this and the clear change in market sentiment, some vendors expectations are now higher than the market is willing to pay and it’s likely we will start to see some choosing to hold off selling after ‘testing’ the market.
Marlborough had a record median price increase and low sales count, indicating this area remains an attractive choice where confident buyers are still present.
For those motivated to sell, conversations with real estate professionals will be vital to understanding the nuances of the local market and ensuring the best outcome.
April shows a further slowdown in sales activity
Across New Zealand, the number of residential property sales decreased annually by 35.2% in April 2022, from 7,497 in April 2021 to 4,860. The sales count for New Zealand excluding Auckland, decreased 31.7% annually from 4,815 to 3,287.
Month-on-month, there was a 29.3% decrease in sales count for the country. We expect sales numbers to fall in the month of April as March is typically one of the stronger months in the annual property market cycle. So, while the nominal change is significant, the seasonally adjusted figures for New Zealand show a decrease of 0.9% moving from March to April — only a marginally weaker result than usual for the month.
Looking at the seasonally adjusted figures over time, the pace of the market change is stark. Through mid-2021, the seasonally adjusted month-on-month sales count was negative due to low levels of supply and high demand. After a stronger than expected October, it returned to negative seasonally adjusted figures — this time marking the introduction of the CCCFA changes and growth in available stock — shifting the market from one underpinned by high demand (2021) to one of high supply (2022).
All regions saw an annual decrease in the number of sales; those with the greatest annual percentage decrease were:
- Marlborough, which decreased 53.6% annually from 84 to 39
- Auckland, which decreased 41.3% annually from 2,682 to 1,573
- Hawke’s Bay, which decreased 39.2% annually from 209 to 127
- West Coast, which decreased 38.3% annually from 47 to 29
Excluding lockdown influenced April and May 2020, this was the greatest annual percentage decrease in sales in Marlborough since July 2020, Wellington since January 2009 (down 34.6% annually to 515), and Northland since June 2017 (down 36.9% annually to 142).
With more moderate price growth and properties staying on the market for longer, it appears favourable to buyers backed by equity.
We’re now in the phase of the property cycle where demand has weakened, sale counts are down but prices remain high. We’re seeing a slowdown in activity, there is more stock staying on the market for longer, and while annual price growth is more moderate, the month-on-month trend shows a fall in median prices.
Looking at the underlying reasons for the continued decrease in sales count, the seasonally adjusted figures provide some insight. Last year sales volumes were underperforming due to supply challenges, and post-October 2021 when we began to see an influx of stock, it became a market underperforming due to demand challenges.
Falling attendance at open homes and auction rooms, and a decrease in buyer enquiries were reported across New Zealand — exacerbated by a spate of public holidays through April. Affordability, uncertainty and changing financial conditions remain primary concerns.
Tighter lending criteria, LVRs, and increasing interest rates coupled with inflation continue to create challenges for some buyers — particularly first home buyers and investors.
Those who are backed by equity and secure in a job market with a low unemployment rate, will continue to see opportunity in the market as more stock increases choice, and prices ease. Owner-occupiers are the most present and active in the market, so while we see a softening in the mid to low price range, interest is solid in the mid to high bracket.
Increases to the OCR, most recently by 0.5% in April, have further impacted affordability, and with the cost to own increasing, property may seem less attractive.
With a forecast peak of over 3.0%, some potential buyers may hold off purchasing in a market where interest rates are likely to rise. For those who purchased property over recent years, these increases were largely expected and factored into banks’ requirement for borrowers to be able to service mortgage increases — providing a buffer for most. The challenge will be for those re-fixing their mortgage.
REINZ HPI: annual house value increases show deceleration
The REINZ House Price Index (HPI) for New Zealand, which measures the changing value of residential property nationwide, showed an annual increase of 6.3% from 3,774 in April 2021 to 4,013 — though down 6.2% from its peak in November 2021. For New Zealand excluding Auckland, the HPI increased 8.9% annually — from 3,805 in April 2021 to 4,142 in April 2022.
There were no regional highs on the HPI this month and for the first time since October 2019, an annual decrease was recorded on the index. Wellington was down 4.2% compared to April last year— from 4,053 in 2021 to 3,881. The Wellington region has ranked in the bottom two on the HPI for six months running.
Canterbury and Northland ranked top of the HPI. Canterbury has been in the top two in terms of HPI movement for seven consecutive months and in April 2022 recorded an annual increase of 19.9% — up from 3,177 in April 2021 to 3,810. Northland has ranked second for four consecutive months, showing an annual increase of 16.7% in April 2022 — from 3,741 to 4,365.
In April, the REINZ HPI showed an annual increase of 6.3% across the country — down 6.2% from its November peak. Weaker results on the HPI suggest buyers — specifically those who are backed by equity — expect to and are paying less. We have heard buyers are increasingly negotiating strongly, suggesting power has shifted from sellers. This may continue in coming months, and those committed to selling their property will adjust to meet the market.
Annual increase in median days to sell
In April, the median number of days to sell (DTS) a property nationally increased nine days to 38. While in New Zealand excluding Auckland it increased by 10 days to 38.
Two regions saw an annual decrease in the median DTS; West Coast, down five days to 27, and Nelson, down two days to 27 — both had the lowest median days to sell nationally.
Southland and Tasman had their highest median DTS since May 2020. Excluding April and May 2020, it was Southland’s highest median DTS since January 2019 and Tasman’s highest since February 2019.
Inventory scales tip — supply outweighs demand
In April 2022, the total number of properties available for sale nationally increased 70.8%, from 15,838 in April 2021 to 27,050. For New Zealand excluding Auckland, inventory increased 93.3%, from 8,825 to 17,060.
All regions had at least a 20% annual increase in inventory, with seven recording over twice as much as they had one year ago. For the sixth consecutive month, Manawatu/Whanganui and Wellington saw the most significant annual increases — up 174.6% and 157.4% respectively. Hawke’s Bay, Bay of Plenty, Nelson, Waikato and Otago all had increases in inventory levels of over 100% compared to April 2021.
In terms of listings, Nelson, Hawke’s Bay and Bay of Plenty saw an increase in listings of over 20% compared to the April prior.
The most significant year on year decrease in listings was in Gisborne, down 21.2% compared to April 2021. Canterbury, which continues to show strength in market, has had 11 months where listings have been less than they were the year prior. West Coast has had 10 consecutive months of the same.
The decrease in demand caused by changes to broader economic conditions coincides with an increase in supply. In April 2022, there was a significant increase in the number of properties available for sale across New Zealand — up 70.8% on April last year. The level of stock now on the market reflects a shift in dynamics whereby supply is outweighing demand — the reverse of what we saw throughout 2021.
As evidenced by the median days to sell, stock is staying longer on the market. There are a number of factors at play, from lending criteria lengthening the sales process to people hitting pause — buyers unwilling or unable to pay market prices and vendors not wanting to sell for less than their desired (if now unrealistic) price.
Overall, we have not seen a rush of new listings; rather, the significant increase in inventory levels is being caused by the slowing pace of sales. For example, looking at the annual figures for New Zealand excluding Auckland, in April listings were up 3.0%, sales were down 31.7% and the result was a 93.3% increase in inventory.
In theory, more stock and a slower pace of sales is good news for all buyers, giving them choice and more time to shop around and undertake due diligence. However, compounding factors make for a more complex scenario. Property prices remain relatively firm and the current financial and economic environment has curbed some buyers’ appetite and ability to engage in the market.
Inventory and Listings data come from realestate.co.nz.
Auction sales fall further in April
April saw 721 properties sell by auction, with auctions falling from 29.8% of sales in April 2021 to 14.8% in April this year. In March 2022, 19.5% of sales were by auction. The percentage of sales by auction recorded in New Zealand excluding Auckland was 10.7% in April 2022 compared to 20.1% in April 2021.
The highest percentage of sales by auction was in Canterbury at 25.6% (195) — down from 32.1% (360) at the same time last year. Gisborne had the second highest percentage of sales by auction at 24.1% (7).
In Auckland, the percentage of sales by auction was 23.4% in April 2022 — down from 47.1% the year prior. This was the lowest percentage of sales by auction since June 2020.
Auction clearance rates have eased and reports from across New Zealand say there are fewer people attending — which is what we are seeing more generally as demand is down and sales are taking longer.
In a slower market, there tends to be a trend away from auctions. However, those who do attend are serious buyers, and are still bidding for the right property, in the right price range.
Selling by auction creates the ideal environment to establish the market price at a given point in time. Real estate professionals, backed by market and local knowledge, are best placed to advise on whether selling by auction is the right method of sale for your property and stated outcomes.


