
February shows while sales activity is down, demand remains and stock on the market is up, with property prices continuing to climb but at a more moderate pace, REINZ Chief Executive Jen Baird says


Market sentiment has shifted over the past couple of months which is evident throughout our February data. While prices remain strong — increasing annually in all regions — the number of sales continue to trend downwards and an influx of stock across New Zealand is easing demand side pressure, which may in turn further ease price growth in the coming months.
Median prices for residential property across New Zealand increased 13.5% annually, from $780,000 in February 2021 to $885,000 in February 2022.
The median residential property price for New Zealand excluding Auckland increased 20.6% from $651,000 in February 2021 to $785,000 — a new record high.
Auckland’s median residential property price increased 8.2% annually, from $1,100,000 in February last year to $1,190,000 — though down 0.8% on January. The annual percentage increase is the lowest that we have seen in the region since June 2020.
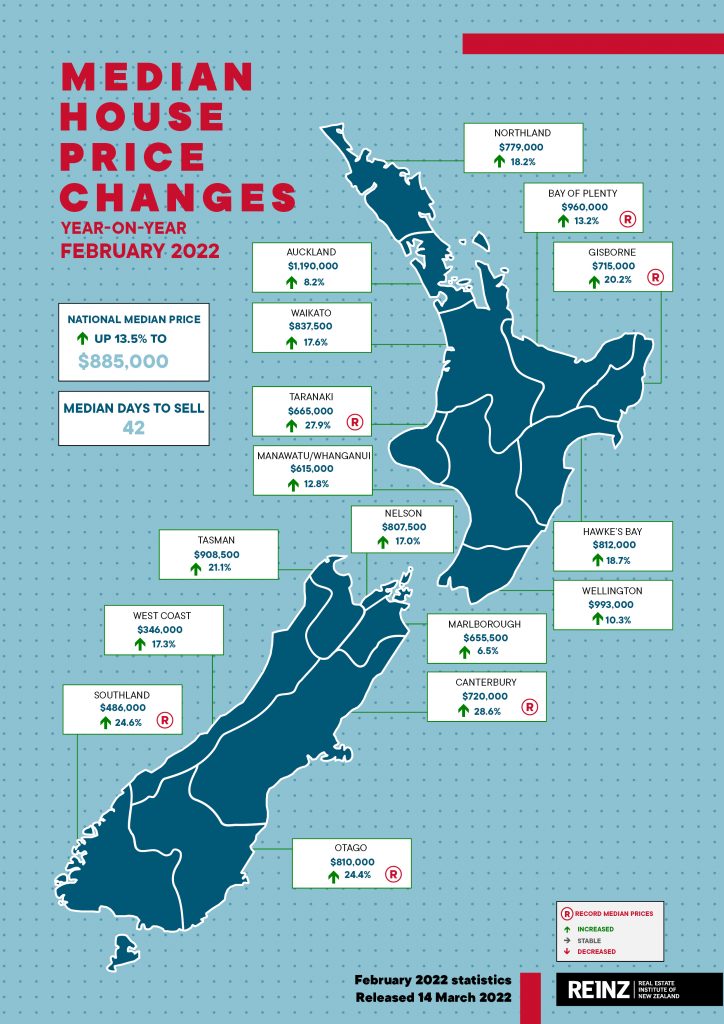
In February, six regions achieved record medians, making this an above average February month, and there were 23 territorial authority (TA) median records. Regional records were achieved in:
- Canterbury — increased 28.6% annually from $560,000 to $720,000. Additionally, Christchurch City ($731,000), Selwyn District ($890,000), Timaru District ($508,000), and Waimakariri District ($757,000) reached record medians
- Taranaki — increased 27.9% annually from $520,000 to $665,000. Additionally, New Plymouth District ($730,000) reached a record median
- Southland — increased 24.6% annually from $390,000 to $486,000. Additionally, all three TAs in the region reached record medians: Gore District ($435,000), Invercargill City ($484,500), and Southland District ($525,000)
- Otago — increased 24.4% annually from $651,000 to $ $810,000. Additionally, Dunedin City ($685,000), Queenstown-Lakes district ($1,385,000), and Waitaki District ($505,000) reached record medians
- Gisborne — increased 20.2% annually from $595,000 to $715,000
- Bay of Plenty — 13.2% annually from $848,250 to $960,000, a new record median high for the third month running. Additionally, Kawerau District ($493,000), Rotorua District ($720,000), Tauranga City ($1,100,000), and Western Bay of Plenty District ($1,050,000) reached record medians.
The regions with the lowest annual price growth were Marlborough and Auckland, at 6.5% and 8.2% respectively.
In February, the median price increased 13.5% nationwide to $885,000. While down from the November 2021 peak ($925,000), following decreases in December and January, prices in February saw a moderate positive change of 0.6%, with six regions reaching record medians.
Canterbury continues to see healthy increase in its median price, reaching a record high in February. This continued growth is driven by districts such as Selwyn and Waimakariri, which have both reached record medians in eight of the past 12 months. Since its peak in November 2021, Auckland has seen a significant drop in the annual percentage increase at a level not seen since LVRs started to effectively curtail rapid property price rises in late 2015.
While prices are holding despite the change in market dynamics, there is now a fear of over paying (FOOP) amongst buyers, some of whom will be under additional pressure from legislative and fiscal changes impacting their ability to borrow. As a shift in sentiment sets in and buyers are less willing, or unable, to pay the prices we saw towards the end of 2021, pressure will come on vendors to adjust their expectations to meet the market.
For those selling, conversations with their real estate professional will help provide a better understanding of what is happening in the market right now, get a feel for market values and the most effective approach to achieve the best outcomes.
Sales down year on year
Across New Zealand, the number of residential property sales decreased 32.8% in February 2022, from 8,324 in February 2021 to 5,597. There was a 48.8% increase in sales count from January. However, the seasonally adjusted figures show a decrease of 3.2% from January to February, indicating this was a marginally weaker February than is typical.
The sales count for New Zealand excluding Auckland, decreased 28.8% annually from 5,412 to 3,856 — the lowest sales count in a February month since 2011.
All regions saw an annual decrease in numbers of sales. Auckland saw the number of properties sold decrease 40.2% annually — from 2,912 in February 2021 to 1,741 in February 2022. This was the lowest February sales count in Auckland since 2019.
Additionally, the regions with the greatest annual percentage decrease in sales volumes were:
- West Coast, which decreased 55.6% annually from 90 to 40 — the lowest sales count for a February month since 2017
- Taranaki, which decreased 41.3% annually from 206 to 121 — the lowest sales count for a February month since records began
- Manawatu/ Whanganui, which decreased 40.1% annually from 382 to 229 — the lowest sales count for a February month since records began.
While prices continue to increase, albeit at a more moderate pace, sales activity is down and with more property on the market, the supply and demand scale is tipping. The number of residential property sales decreased 32.8% compared to February 2021. Compared to January, the sales count was up 48.8% across New Zealand. However, when we allow for seasonal trends, the adjusted figures show a slight decline of 3.2% — in terms of the number of sales, February was a slower month than expected.
The Credit Contracts and Consumer Finance Act (CCCFA), the reintroduction of LVRs and increases to the OCR — with further increases expected — are affecting buyers who are increasingly showing caution. While the appetite and demand for property remains, we are hearing from agents across the country that open homes and auction rooms are quieter.
Record low levels of properties available for sale last year — as well as low interest rates and anticipation of LVRs — brought urgency to the New Zealand property market. However, towards the end of 2021, we saw a surge in the number of listings. This has continued into February, with listings across New Zealand up 7.5%, bringing more choice to the market. Hawke’s Bay, Manawatu/Whanganui and Wellington all have over 25% more listings than February 2021.
The increase in available properties and the subdued demand, is having a depressive effect on sales activity. Market sentiment has shifted and with pressure to buy easing, we are seeing less competition, less urgency and fewer sales.
REINZ HPI: house value increases show deceleration
The REINZ House Price Index (HPI) for New Zealand, which measures the changing value of residential property nationwide, showed an annual increase of 14.3% from 3,655 in February 2021 to 4,178.
The HPI for New Zealand excluding Auckland showed an annual increase in house values of 17.3% from 3,649 in February 2021 to 4,280 in February 2022 — a new high on the index.
Four regions reached new highs on the index:
- Canterbury increased 29.4% annually to 3,919
- Northland increased 22.5% annually to 4,412
- Tasman/Nelson/Marlborough/West Coast increased 16.3% annually to 3,457
- Otago increased 15.3% annually to 4,177.
Annual growth in the HPI remains in the double figures, showing an annual increase of 14.3%. Regional movements were generally positive, with four regions reaching new highs on the index.
Canterbury has had the greatest annual HPI movement for four months in a row, signalling the underlying strength in that market. At the other end of the spectrum, Wellington has now been in the bottom two for annual HPI movement four months in a row. The Auckland HPI has been dropping over the past three months, when we look at the trend for the three months ending February 2022, we note a decrease of 5.5%. For Auckland in particular, the HPI tends to be a lead indicator for the market. However, the median price is steady, albeit a touch down on previous performance.
As median price growth stabilises and the market acclimatises to a shift in sentiment, it will be interesting to see what March brings, a month that is generally stronger and busier than February.
Annual increase in median days to sell
Nationally, the median number of days to sell a property increased 11 days to 42 in February 2022. The median days to sell in New Zealand excluding Auckland also increased by 11 days to 40.
Properties sold fastest in Tasman at 24 days — the only region to see a decrease in the median number of days a property stayed on the market.
Gisborne, Hawke’s Bay, Manawatu/Whanganui, Nelson, Otago, and Southland all had their highest median days to sell since May 2020. Hawke’s Bay and Northland both had the highest median days to sell at 50 days — while this was an increase of five days in Northland, Hawke’s Bay increased 19 days. Manawatu/ Whanganui had the greatest increase in days to sell, doubling annually to 48 in February 2022.
The median number of days to sell increased annually in all but one region, with Tasman bucking the trend. Properties are selling, it is just taking longer. This will be due to a number of factors, such as increased choice on the market and buyers less urgent, securing finance taking longer and some vendors not achieving their expected prices and choosing to hold off rather than sell for less than they hoped.
Levels of inventory continue upward trend
In February 2022, the total number of properties available for sale nationally increased 47.0%, increasing from 15,829 in February 2021 to 23,270. For New Zealand excluding Auckland, inventory increased 53.5%, from 8,633 one year ago to 13,253.
All but two regions showed an annual increase in inventory levels. The West Coast saw a decrease of 7.6% compared to February 2021, from 171 to 158, and Gisborne saw a decrease of 1.0%, from 103 to 102.
Manawatu/Whanganui and Wellington again recorded over twice as much inventory as they had one year ago, with increases of 161.7% and 143.4% respectively.
After a prolonged period of low inventory in 2021, we have seen inventory levels rise nationwide for two months consecutively. While the West Coast and Gisborne saw a decrease in stock in February, all other regions saw increases, some quite significant. Inventory levels in Manawatu/Whanganui increased 161.7%, Wellington was up 143.4%, and Hawke’s Bay increased 98.4%.
With market prices still strong and more available properties available giving those who are upsizing, downsizing or looking for a change confidence, people are incentivised to sell – bringing more stock to the market. Further, with properties taking longer to sell in most regions, stock is building.
In economic terms, greater supply and less demand will alleviate competition in the market leading to less upward pressure on property prices.
Inventory data comes from realestate.co.nz.
Auction room activity sees minor dip annually
February saw 1,231 properties sold by auction across New Zealand, 22.0% of all properties sold — down from 28.4% at the same time last year. The percentage of sales by auction recorded in New Zealand excluding Auckland was 17.6% in February 2022 compared to 19.1% in February 2021.
The highest percentage of sales by auction was in Gisborne at 54.3% (25) — down from 70.3% at the same time last year. The Canterbury region had the second highest percentage of sales by auction at 34.8% (306) compared to 25.8% last year, followed by Auckland where 31.8% (553) of sales were by auction — down from 45.6% in February 2021.
Auctions have gained popularity in many regions across New Zealand over the past couple of years. However, February was a mixed bag in terms of auction representation, with many regions reporting a fall off in attendance, though noting genuine buyers are still present and bidding.
In February, Canterbury, Marlborough and Northland all saw the greatest percentage of properties sold by auction in a February month since records began in 1992. Canterbury in particular has seen auctions increasingly become the preferred method, reflecting the strength of the market in the region. That said, we have heard there was a drop in clearance rates, a combination of access to finance and market expectations out of kilter with vendor expectations.
Sales by auction are unconditional, so it’s vital that finance is confirmed before bidding. For first-time buyers this may be an additional barrier to entry. With increasing reports of transactions being subject to sale or subject to finance, we may see a further decrease in the numbers of those in attendance and thus the number of properties sold by auction.


