
Seller confidence is returning and we can expect a more normal spring ahead for the property market, REINZ Chief Executive Jen Baird says following the release of August’s statistics


The Real Estate Institute of New Zealand’s (REINZ) August 2023 figures show continued optimism and further activity in the property market. While listing numbers remain light, they are up on July and sales counts have increased, showing some late winter confidence.
REINZ Chief Executive Jen Baird says August often shows a resurgence of activity as Spring approaches.
“We saw steady activity this month with increased sales counts both compared to August 2022 and last month. This lift in market activity has also seen the median days to sell decrease this month,” Baird says.
Compared to August 2022, August 2023 saw an increase in the total number of properties sold across New Zealand, up 9.2% to 5,509, from 5,047, and up 9.2% month-on-month. For New Zealand excluding Auckland, sales counts also increased by 5.2% year-on-year from 3,508 to 3,690.
Across the regions, Northland (4.5%), Auckland (18.2%), Waikato (16.2%), Manawatu-Wanganui (8.6%), Tasman (8.0%), Nelson (12.3%), Marlborough (38.1%), Canterbury (24.9%) and Southland (4.2%) all saw increases in sales counts year-on-year.
“Local agents are reporting that, as new listing numbers continue to decrease, the demand for entry-level property is holding and fairly strong, and properties are starting to move quicker,” says Baird.
The national median days to sell reduced by 6 days year-on-year and 5 days month-on-month, a change from the trend for many months of increased days to sell. Eleven regions saw a decrease in the median days to sell compared to July 2023, with the biggest decrease occurring in Nelson, which dropped 18 days from 60 days to 42 days.
At the end of August, the total number of properties for sale across New Zealand was 22,750, down 10.6% (2,691 properties) from 25,441 year-on-year, and down 1.5% month-on-month. New Zealand excluding Auckland inventory was down year-on-year from 15,196 to 14,099, a decrease of 1,097 properties or 7.5% annually.
Nationally, new listings decreased by 0.6% from 7,492 listings to 7,444 year-on-year and increased 20.9% compared to July 2023. For New Zealand excluding Auckland, listings decreased 4.2% year-on-year from 4,749 to 4,550 and increased 18.3% month-on-month.
“The number of properties available for sale over the last three months continues to fall. Listings are still at lower levels compared to August 2022, but only slightly. Month-on-month we have seen a 20.9% increase of stock coming to market, suggesting seller confidence is returning and we can expect a more normal spring ahead for the property market,” comments Baird.
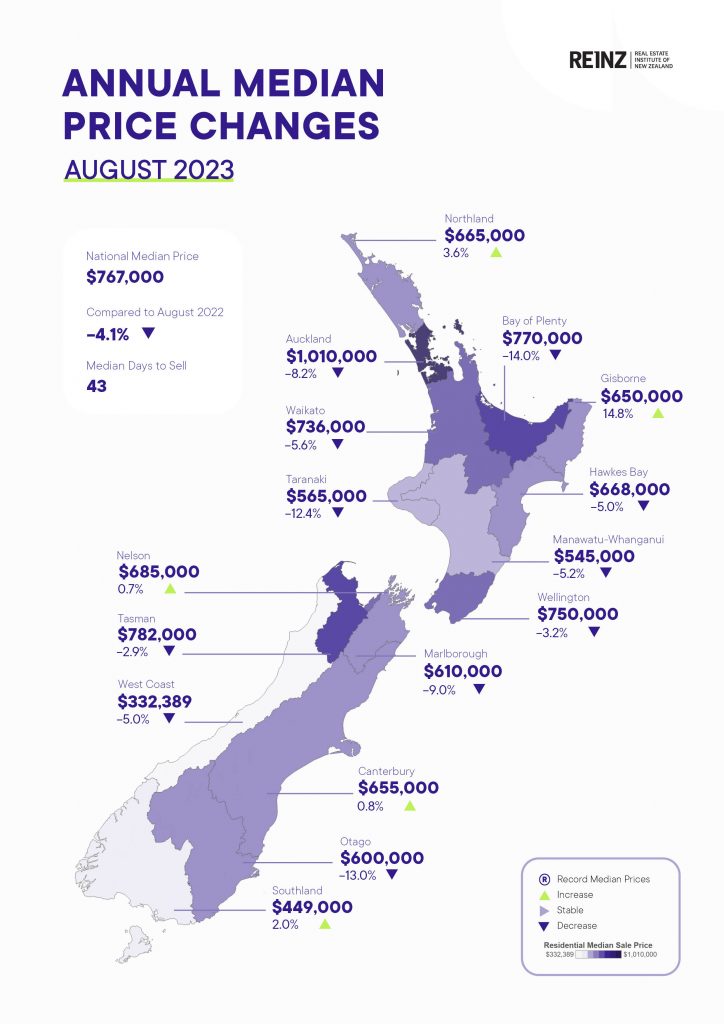
Nationally, the August 2023 median sale price decreased 4.1% year-on-year to $767,000 from $800,000.
Regionally, median sale prices remained down year-on-year except for five regions: Nelson +0.7%; Canterbury +0.8%; Southland +2.0%; Northland +3.6% and Gisborne up 14.8% year-on-year and up 13.0% month-on-month. Auckland, the country’s largest property market, saw its median sale price move back up over the $1 million mark to $1,010,000 increasing 2.0% month-on-month, but decreasing 8.2% year-on-year.
Wellington saw month-on-month increases with the median sale price up 2.3% from $733,000 to $750,000, and a 16.9% increase in the number of properties sold from 438 to 512 month-on-month. Days to sell month-on-month decreased from 52 to 38, a 14-day decrease.
“Higher interest rates and ongoing cost of living pressures continue to impact the market ahead of the looming election. There is a sense across the country that the market has seen the bottom both in terms of prices and sales volumes, but we are all waiting to see how long it will take to see growth reemerge,” comments Baird.
The HPI for New Zealand stood at 3,588 in August 2023, showing a 0.9% increase compared to the previous month. However, when compared to the same period last year, the HPI reflects a 4.7% decline. The average annual growth in the New Zealand HPI over the past five years has been 5.7% per annum. It remains 16.1% below the peak.
National highlights for August 2023
- The national median price has decreased 4.1% from $800,000 to $767,000. For New Zealand excluding Auckland, median prices decreased 4.3% from $700,000 to $670,000 year-on-year.
- The total number of properties for sale across New Zealand decreased 10.6% year-on-year and was also down 1.47% month-on-month.
- The total number of properties sold across New Zealand in August 2023 increased 9.2% year-on-year to 5,509, and also increased 9.2% month-on-month.
- Nationally, new listings decreased 0.6%, from 7,492 listings in August 2022 to 7,444 listings in August 2023, and increased 20.9% month-on-month.
- Days to sell have decreased by 5 days for August 2023 month-on-month and decreased 6 days year-on-year.
- The REINZ House Price Index (HPI) for New Zealand showed an annual decrease of 4.7% in the value of residential property nationwide.
Regional highlights
- Nelson (0.7%), Canterbury (0.8%), Southland (2.0%), Northland (3.6%) and Gisborne (14.8%) saw an increase in median sale price year-on-year with Gisborne also up 13.0% month-on-month.
- Southland had the biggest month-on-month increase in sales count with a 25.5% rise and a 4.2% increase year-on-year, followed by Manawatu-Whanganui with a 20.5% increase month-on-month and an 8.6% increase year-on-year.
- Wellington saw month-on-month increases in median sale price up 2.3% from $733,000 to $750,000, a 26.9% increase in the number of properties sold from 438 to 512 and a decrease in the days to sell from 52 to 38, a 14-day decrease.
Median Prices
Five of sixteen regions had positive year-on-year median price movements, the largest being Gisborne with +14.8%.
Eight regions (50%) had positive month-on-month movements, Gisborne again leading the way with a 13.0% increase.
With Wellington, six of eight Territorial Authorities had negative year-on-year median price movements with South Wairarapa District worst hit at -28.8%, but Porirua City and Wellington City seeing a 30.8% and 3.5% increase respectively, compared to August 2022. This was the first time since April 2022 (16 months ago) that Wellington City showed a year-on-year increase in median price and the second month in a row that Porirua showed a year-on-year increase.
Hastings District and Kaipara District have both had three consecutive months of year-on-year increases, the most of all Territorial Authorities.
In terms of the month of August, this August saw the lowest sales count in:
- Wellington since 2010
- Otago and West Coast since 2014
In terms of the month of August, this August saw the highest sales count in:
- New Zealand excluding Auckland, Canterbury, Manawatu-Whanganui, Nelson and Southland since August 2020
Median Days to Sell
Tasman had its highest median days to sell since September 2008.
Wellington had its lowest median days to sell since December 2021.
New Zealand, New Zealand excluding Auckland, Auckland and Canterbury had their lowest median days to sell since December 2022.
In terms of the month of August, August 2023 had the highest median days to sell in:
- Tasman since 1999
- Taranaki since 2013
- Gisborne and Marlborough since 2014
- Northland since 2019
House Price Index (HPI)
No regional HPI records this month.
Both Otago and Southland had year-on-year HPI increases this month. This is the first time since October 2022 that any region has had a year-on-year increase in HPI.
Wellington’s run of being in the bottom two ranked regions for year-on-year HPI movement has ended after 21 consecutive months between November 2021 and July 2023. Wellington ranked fifth overall this month.
Otago is the top-ranked HPI year-on-year movement this month. Southland is second and Canterbury is third.
In terms of the three months ending HPI movement, Southland ranks first, Otago second and Wellington third.
Inventory
Seven of fifteen regions have had a decrease in inventory in August 2023 compared to one year prior.
Listings
Seven of the fifteen regions had a year-on-year increase in listings. This is the highest number of regions with a year-on-year increase in listings since October 2022.
Inventory and listing data come from realestate.co.nz.
Auctions
Nationally, 14.3% (786) of properties were sold at auction in August 2023, compared to 9.3% (467) in August 2022.
New Zealand excluding Auckland saw 8.3% of properties (306) sell by auction compared to 7.2% (254) the year prior.


