
September’s house price dip may have just been an anomaly as New Zealand’s median house price shot back up by $100,000 in October, REINZ data finds


“Despite some officials in Wellington doing their best to talk down the real estate market, it remains incredibly strong with summer now looking decidedly up,” says Century 21 New Zealand Owner Tim Kearins.
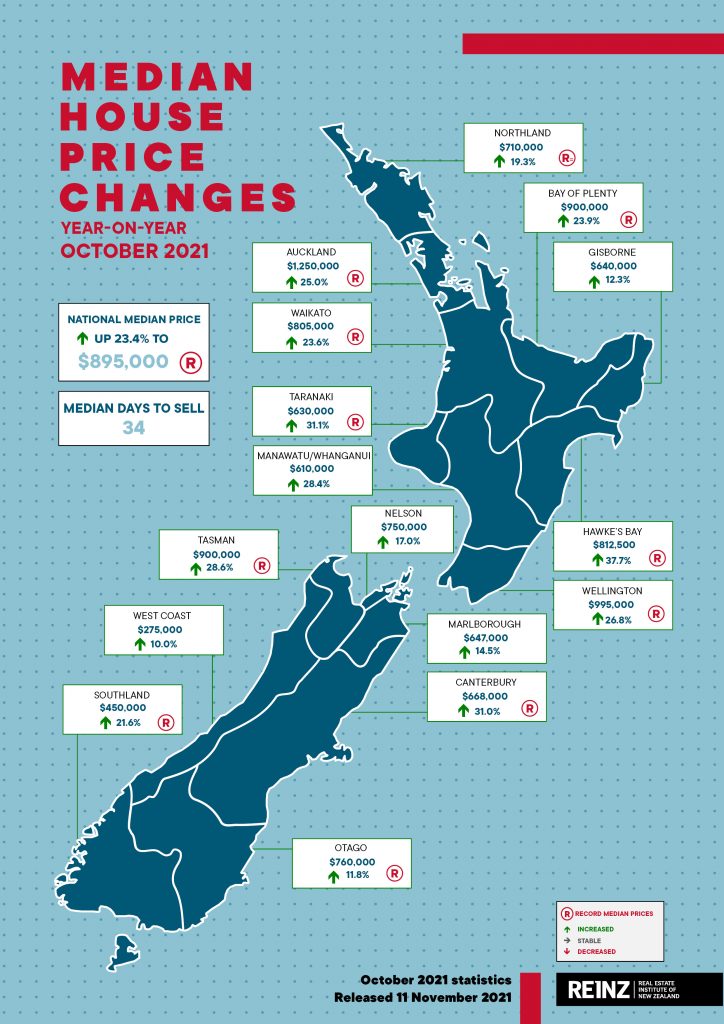
His comments follow REINZ releasing its Monthly Property Report for October – a month which saw median house prices across New Zealand increase by 23.4% to $895,000 compared to the same time last year. Ten out of 16 regions reached median price records, and one had an equal price record — the most since March 2021.
“The lack of supply, high demand, and relatively low interest rates continue to drive price increases, with buyer FOMO also contributing to this healthy spring bounce. Let’s just say those who may have been waiting for a price fall have stopped waiting,” says Kearins.
The Century 21 leader says most notably the month-to-month national median house price increased by 3.3%, after it decreased the previous month.
The challenge for the sector now, he says, is to increase listings. The total number of properties available for sale in New Zealand was down by 16.1% compared to October last year, although up from September.
“With it feeling more and more like summer, we will see the number of property listings start to lift. It all bodes well for a strong real estate season, despite the pandemic, lockdowns, and ongoing restrictions,” says Kearins.
Low listings effecting sales, but still up from September
The number of residential property sales across New Zealand decreased by 21.7% year-on-year, from 9,185 in October 2020 to 7,190 in October 2021. However, there was a significant increase in sales month-on-month — up 30.3% from September (5,518). October’s sales activity shows a market revitalised by easing COVID-19 restrictions, the spring lift and growing confidence in vendors and buyers to make decisions about their housing.
For New Zealand excluding Auckland, the number of properties sold in October 2021 decreased 22.5% year-on-year to 4,614 (October 2020: 5,951). Again, sales increased month-on-month by 11.7% (September 2021: 4,129).
In Auckland, the number of properties sold in October decreased by 20.3% year-on-year (October 2020: 3,234, October 2021: 2,576). The increase month-on-month shows the market’s resilience, with 85.5% more properties sold in October than in September 2021 (1,389). Despite prolonged restrictions, the Auckland market seems to have found its rhythm again. The ability to conduct business remotely and eased restrictions around viewings have enabled real estate continuity, while a general FOMO — fear of missing out – stokes a market that remains strong.
Tasman had its highest sales count since November 2020, and Bay of Plenty had its highest since March 2021.
The regions with the greatest annual percentage decrease in sales volumes were:
- West Coast: -55.2% (from 58 to 26 – 32 fewer houses). The region’s lowest sales count since April 2020 and its lowest October month sales count in six years
- Northland: -40% (from 290 to 174 – 116 fewer houses). The region’s lowest October month sales count since 2012
- Marlborough: -38.9% (from 108 to 66 – 42 fewer houses).
Jen Baird, Chief Executive at REINZ, says: “October shows a marked increase in sales activity on September and August, boosted by the usual spring uplift. While across New Zealand, sales activity decreased year-on-year by 21.7%, there was a 30.3% increase month-on-month. Auckland saw the most significant uptick in month-on-month sales activity, with 85.5% more properties sold in October than in September 2021. Despite the restraints the market is operating under, this is a stronger than average October month. We’re seeing the continuation of what is a firm market, despite the pandemic.
“Lockdown restrictions are having a reduced impact. Real estate professionals have the resources to conduct business remotely, and customers/clients have the confidence to move forward to make decisions. Steps by the Government — as advocated for by REINZ on behalf of members — to enable more private property viewings at Alert Level 3, for example, have helped – especially in areas longest affected by tighter lockdown. Less stringent restrictions equate to more activity.
“Comparing listing and sales activity over this lockdown to the country’s first one in 2020, shows a sharp difference. Namely, the impact has not been so severe, and the recovery has been quicker.
“October is the beneficiary of increased listings in the month prior. It is expected that sales activity across New Zealand will continue to rise in the coming months, as restrictions ease further, travel limitations lift and those who previously held back listing their property do so. The demand is certainly there,” Baird observes.
Steady increase in median prices across New Zealand
Median prices for residential property across New Zealand increased by 23.4% to $895,000 in October 2021 compared to $725,000 in October 2020. This is also up from $795,000 in September 2021, a 12.6% increase in only a month.
Ten out of 16 regions reached median price records, and one had an equal price record — the most since March 2021. The number of price records is above average for an October month, reflecting a firm market reinforced by continued demand.
In October 2021, the median house price for New Zealand excluding Auckland increased by 25.5% to a new record of $753,000 (October 2020: $600,000) and an increase of 4.6% from September 2021 ($720,000).
The median house price in Auckland increased 25.0% to $1,250,000 from $1,000,000 in October 2020 — another record median price. All Auckland districts show year-on-year median price growth and six reached record highs. The median house price in Auckland City was $1,393,000 (up 14.2% on October 2020), Franklin District was $1,000,000 (up 36.1% on October 2020), Manukau City was $1,165,000 (up 17.4% on October 2020), North Shore City was $1,475,000 (up 27.7% on October 2020), Papakura District was $1,101,000 (up 50.8% on October 2020), Waitakere City was $1,128,000 (up 23.3% on October 2020).
Other regions that reached record median prices in October were:
- Waikato: increased 23.6% to $805,000, up from $651,000 in October 2020. Additionally, South Waikato District ($495,000), Hauraki District ($645,000), Thames-Coromandel District ($1,010,000), Waikato District ($825,000) and Waipa District ($880,000) reached record median highs
- Bay of Plenty: increased 23.9% to $900,000, up from $726,500 in October 2020. Additionally, Rotorua District ($695,000), Tauranga City ($1,050,000), and Whakatane District ($755,000) reached record median highs
- Hawke’s Bay: increased 37.7% to $812,500, up from $590,000 in October 2020. Additionally, Central Hawke’s Bay District ($650,000), Hastings District ($885,000), and Napier City ($812,000) reached record median highs
- Taranaki: increased 31.1% to $630,000, up from $480,500 in October 2020. Additionally, New Plymouth District ($700,000) reached a record median high
- Wellington: increased 26.8% to $995,000, up from $785,000 in October 2020. Additionally, Kapiti Coast District ($980,000), Lower Hutt City ($890,000), Masterton District ($720,000), Porirua City ($1,115,000) and Wellington City ($1,157,000) reached record median highs
- Tasman: increased 28.6% to $900,000, up from $700,000 in October 2020
- Canterbury: increased 31.0% to $668,000, up from $510,000 in October 2020 — a four month trend for the region. Additionally, Ashburton District ($500,000), Christchurch City ($685,000), Selwyn District ($815,000) and Waimakariri District ($685,000) reached record median highs. Selwyn has the longest median streak of all territorial authorities, with six record highs in a row
- Otago: increased 11.8% to $760,000, up from $680,000 in October 2020. Additionally, Central Otago District ($782,000), Clutha District ($480,000), Dunedin City ($675,000), Queenstown-Lakes District ($1,355,000) and Waitaki District ($472,000) reached record median highs
- Southland: increased 21.6% to $450,000, up from $370,000 in October 2020. Additionally, Southland District ($510,000) reached a record median high
Northland maintained an equal high, with a median price of $710,000 in October 2021 – an increase of 19.3%.
“The same factors continue to drive price increases — supply, demand and relatively low interest rates. There is also a sense of FOMO driving buyers for now. Median prices for residential property across New Zealand increased by 23.4% to $895,000 in October 2021, and 10 of 16 regions reached median price records — the most since March 2021,” Baird says.
“In Auckland, the median house price increased 25.0% to $1,250,000. All seven legacy Auckland territorial authorities had a median price of $1,000,000 or greater for the first time. The first legacy Auckland territorial authority ‘median million’ was in March 2016.
“House prices continue to show steady growth. Government measures to temper investor demand and recent moves by the Reserve Bank to increase OCR are causing headwinds for house prices. However, the long-term impacts are yet to be seen. We saw the initial lockdown impact on the market in August and September, with market activity slowing. However, October data announces the arrival of spring activity,” Baird notes.
REINZ HPI: house values continue to rise
The REINZ House Price Index (HPI) for New Zealand, which measures the changing value of property in the market, showed an increase of 29.9% year-on-year to 4,206 – reaching a new high on the index. This is the fifteenth consecutive month we have seen a new high.
The HPI for New Zealand excluding Auckland showed an increase in house price values of 33.3% from October 2020 to 4,249 in October 2021, a new high on the index.
Auckland’s house price values increased 25.7% year-on-year to 4,149.
Manawatu-Wanganui has had the top year-on-year movement in HPI of all the regions for six months in a row. In October 2021, the region had the highest annual growth rate in house price values with a record index level of 5,306 – a 42.6% increase year-on-year. Canterbury (+38.0%) and Waikato (+34.1%) had their largest year-on-year increase in HPI since records began.
In October, Northland, Southland and Gisborne/Hawke’s Bay were the only regions not to reach new highs on the REINZ House Price Index. For seven months in a row, Southland has had the lowest or second-lowest year-on-year movement in HPI of all the regions.
Median days to sell
The median number of days to sell a property increased by five days across New Zealand, from 29 days in October 2020 to 34 in October 2021. For New Zealand excluding Auckland, the median number of days to sell increased by one day from 29 to 30 days in October 2021.
Auckland saw an increase of 15 days in the median number of days to sell a property – from 30 in October 2020 to 45 in October 2021. A significant increase, this is the highest median days to sell in the region since June 2020 and the highest for an October month in 20 years.
The West Coast had its lowest median days to sell in an October month since 2006, with a decrease of two days from 36 in October 2020 to 34 in 2021. In Northland, the median days to sell was 37 in October 2021, the region’s equal lowest median days to sell for an October month since records began (equalling October 2005, 2006 and 2007).
Ten regions had a median days to sell of less or equal to 30 days, the most since April 2021. Properties in Tasman sold the fastest, with a median number of days to sell of 25 in October 2021, down from 43 days in September 2021. Only Auckland’s median days to sell was over 40.
“Auckland saw a marked increase in its median number of days to sell, equally it saw an increase in sales. While restrictions have relaxed a little in the region, under Alert Level 3 open homes are not permitted. So, while the volume of activity is there, it is spread out over time — which means the sales process takes longer. Overall, 10 regions had a median days to sell of less or equal to 30 days, the most since April 2021. Properties are selling, and fast,” states Baird.
Auctions continue to trend upwards
Across New Zealand, 30.1% of properties sold by auction in October – compared to 22.8% in October 2020. Auctions in New Zealand excluding Auckland accounted for 21.9% of sales, up from 13.5% last year.
Gisborne again had the highest percentage of auctions across the country, with 48.2% of properties selling by auction (27). However, this was down from 73.4% (47) at the same time last year.
Auckland had the second highest percentage of auctions in New Zealand and its highest since August 2016, with 44.8% (1,153) properties sold by auction in October (October 2020: 39.8% (1,288)). This is an increase on September 2021, when 30.6% of properties sold by auction (425) and highlights increased activity in the region.
The Canterbury region saw 41.2% (439) of properties sold by auction – up from 19.9% (251) in October last year.
“Current restrictions have resulted in a rise in the number of properties sold by auction across New Zealand. In October, the percentage sold by auction was 30.1%, up from 22.8% last year. However, this is an existing trend. Areas such as Gisborne have long had a high auction percentage. What’s interesting to see are regions such as Canterbury, where the percentage of properties sold by auction more than doubled year-on-year (October 2021: 41.2%, October 2020: 19.9%).
“We’re seeing a profession-wide step towards auctions, and they are largely now an expected part of the conversation with vendors. In an uncertain market, auctions are a great way to understand a property’s value by letting the market decide. Vendors want market price with a fixed date and a transparent sales process,” says Baird.
Low levels of inventory underpin demand
The total number of properties available for sale in New Zealand decreased year-on-year by 16.1% in October 2021 to 15,217, down from 18,141 in October 2020 – 2,924 fewer properties compared to 12 months ago. Inventory levels did increase month-on-month.
“There remains a demand vs supply imbalance. Despite recent restrictions, this imbalance continues to drive strong levels of activity and the resulting price growth. While inventory levels were down year-on-year, we have seen a 13.5% increase when compared to September 2021 (13,407), which is great news for buyers,” Baird says.
“The Government has announced urban development rules that increase the ability to freely build medium density residential dwellings to increase housing supply. These changes will take time to deliver but may create more choices for buyers at different price points,” she concludes.
Wellington saw an annual uplift in inventory levels, with a 35.3% increase from the same time last year — increasing to 1,015 in October 2021 (October 2020: 750). Manawatu/Wanganui saw an increase of 31.6% — from 468 properties in October 2020 to 616 properties in October 2021.
Regions with the largest decrease were the West Coast (down 42.6%, from 237 in October 2020 to 136 in October 2021), Nelson (down 39.4%, from 297 in October 2020 to 180 in October 2021), and Northland (down 37.3, from 857 in October 2020 to 537 in October 2021).
Inventory data comes from realestate.co.nz.
$1m+ properties still holding strong
In October 2021, 10.7% of properties sold for less than $500,000 across New Zealand, a drop from 22.4% in October 2020. In September 2021, 14.3% of properties sold for less than $500,000.
The number of properties sold in the $500,000 to $750,000 bracket fell from 30.2% in October 2020 to 24.5%.
At the top end of the market, the percentage of properties sold for $1 million or more increased from 24.8% in October 2020 to 41.4% in October 2021.


