The median house price across New Zealand sits at $730,300 as of January, down from $749,000 in December, yet REINZ Chief Executive Bindi Norwell is still positive

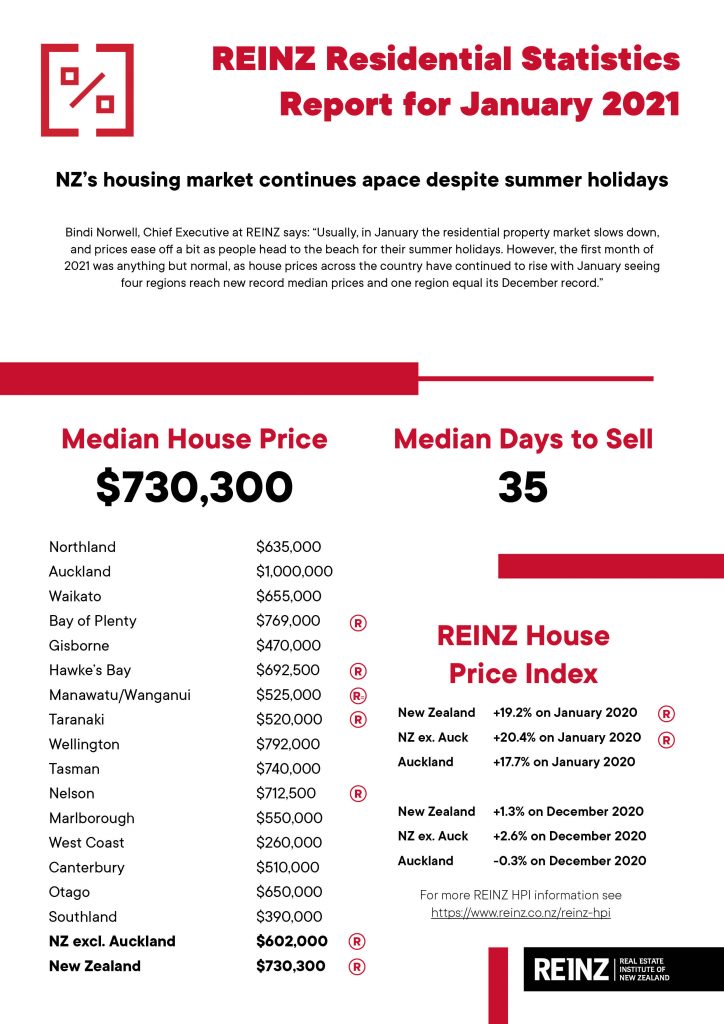
Usually, in January the residential property market slows down, and prices ease off a bit as people head to the beach for their summer holidays, but the housing market was busier and more buoyant than we would usually see at this time of the year.
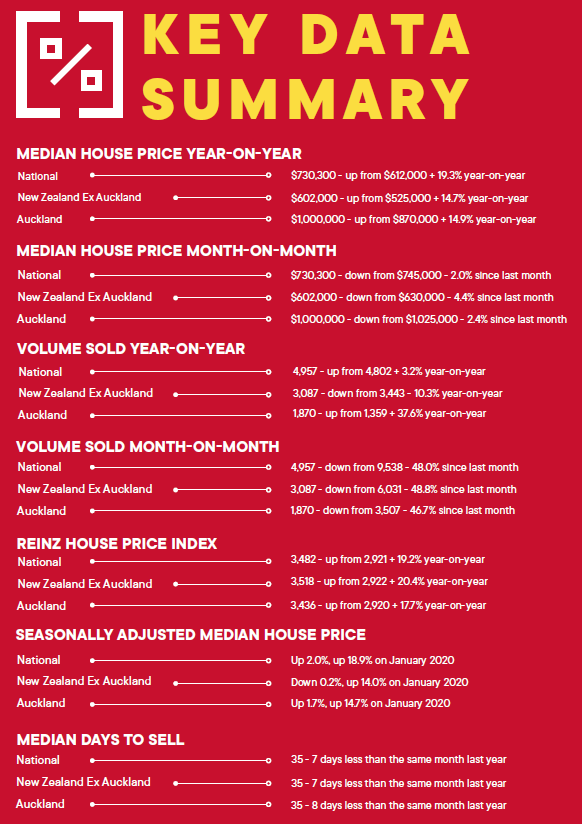
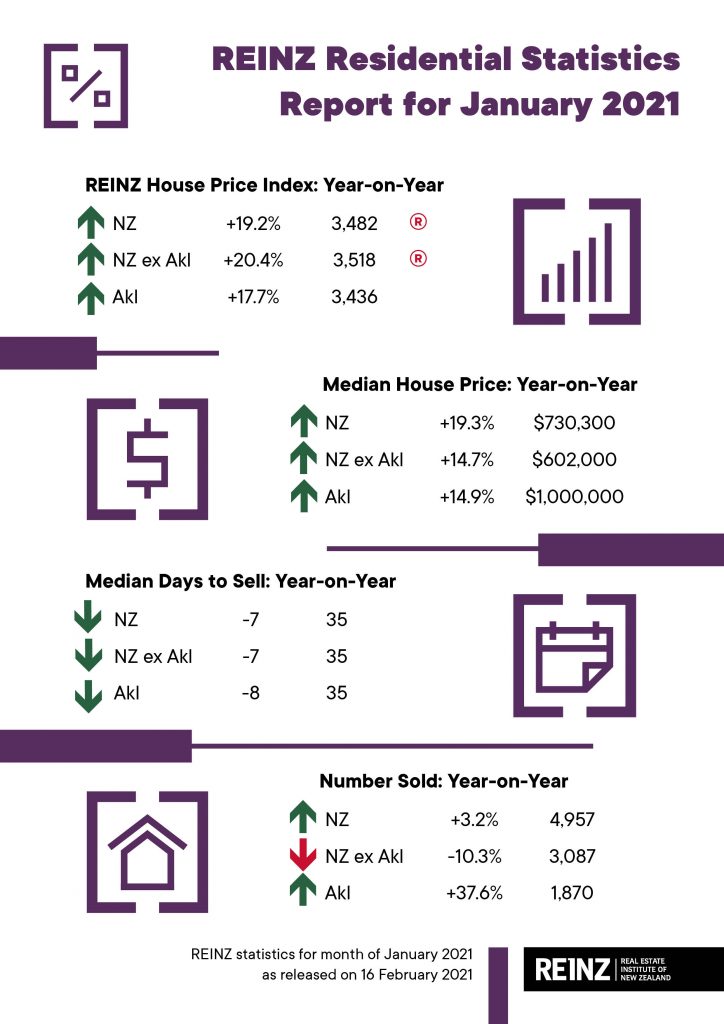
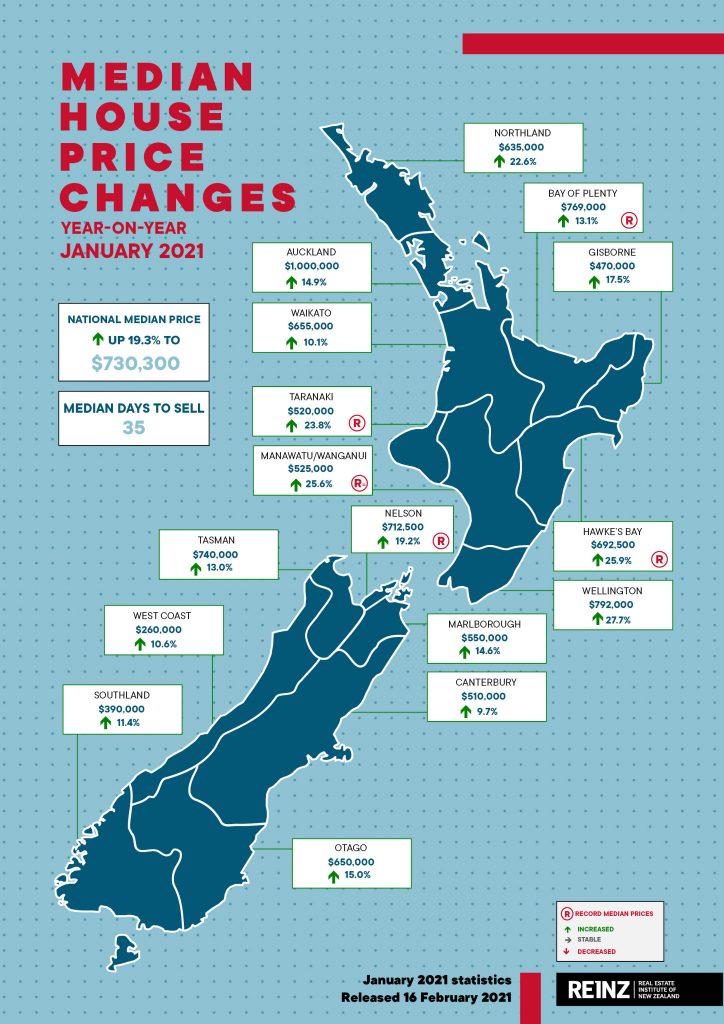
Median house prices across New Zealand increased by 19.3% from $612,000 in January 2020 to $730,300 in January 2021. While median prices were down marginally from December, house prices held up better than we would normally expect when moving from December to January as indicated by REINZ’s seasonally adjusted median pricing data which showed a 2.0% lift.
Median house prices for New Zealand excluding Auckland increased by 14.7% from $525,000 in January last year to $602,000.
Auckland’s median house price increased by 14.9% from $870,000 at the same time last year to $1,000,000.
In January, four regions saw record median prices and one region saw a record equal. Regions with record median prices were:
- Bay of Plenty: with a 13.1% increase from $680,000 in January 2020 to $769,000 in January 2021. Additionally, Kawerau District ($367,000), Rotorua District ($600,000), Tauranga City ($854,000) and Western Bay of Plenty District ($793,500) all reached record median highs in January
- Hawke’s Bay: with a 25.9% increase from $550,000 in January 2020 to $692,500 in January 2021. Additionally, Central Hawke’s Bay District ($590,000), Napier City ($770,000) and Wairoa District ($621,000) all reached record median highs in January
- Taranaki: with a 23.8% increase from $420,000 in January 2020 to $520,000 in January 2021. Additionally, New Plymouth District ($600,000) and South Taranaki District ($395,000) reached record median highs in January
- Nelson: with a 19.2% increase from $597,500 in January 2020 to $712,500 in January 2021
- Manawatu/Wanganui was a record equal remaining on the same median price as December 2020 at $525,000. Additionally, Horowhenua District ($530,000), Manawatu District ($560,000), Palmerston North City ($650,000), Ruapehu District ($391,000) and Whanganui District ($485,000) all reached record median highs in January.
In total, 27 districts around the country reached new record high median prices, with 13 of those districts exceeding last month’s record.
The fear of future price rises and the fear of missing out lingers deep in buyers’ minds and is impacting people’s buying behaviour as January saw a continuation of properties selling at a rapid pace. Last month, residential properties sold at their fastest pace for a January month in 17 years, carrying on the pattern we’ve seen over the past few months and therefore continuing to impact pricing.
The Auckland market saw a slight cooling off in prices when compared to the record high we saw in December 2020, which is what we would expect at this time of the year. Interestingly, when we look at the data from a seasonally adjusted perspective, house prices were actually higher than we would normally expect at this time of the year (+1.7%). North Shore City ($1,255,000) and Rodney District ($1,100,000) again reached new record median prices showing how there is still strong competition for good properties in the region and how affordability continues to be an issue.
January’s sales volumes highest for month of January in 5 years
The number of residential properties sold in January across New Zealand increased by 3.2% when compared to the same time last year (from 4,802 to 4,957) – the highest for the month of January in 5 years.
For New Zealand excluding Auckland, the number of properties sold decreased by 10.3% when compared to the same time last year (from 3,443 to 3,087) – the lowest for the month of January for 7 years and the first annual decrease in 8 months.
In Auckland, the number of properties sold in January increased by 37.6% year-on-year (from 1,359 to 1,870) – the highest for the month of January in 14 years. North Shore and Manukau Cities both saw annual sales volume increases exceed the 50% mark showing how strong demand is in these popular parts of the City of Sails.
In addition to Auckland, six regions saw increases in annual sales volumes during January:
- West Coast: +54.1% (from 37 to 57 – 20 more houses) – the highest for the month of January in 15 years
- Southland: +18.4% (from 114 to 135 – 21 more houses)
- Gisborne: +7.7% (from 26 to 28 – 2 more houses)
- Canterbury: +6.4% (from 708 to 753 – 45 more houses) – the highest for the month of January in 14 years
- Northland: +3.8% (from 158 to 164 – 6 more houses) – the highest for the month of January in 5 years
- Waikato: +2.8% (from 493 to 507 – 14 more houses) – the highest for the month of January in 5 years.
At the other end of the spectrum, seven regions saw their lowest January sales volumes in a number of years:
- Wellington – the lowest for a January month ever
- Tasman – the lowest for a January month in 21 years
- Hawke’s Bay – the lowest for a January month in 10 years
- Marlborough – the lowest for a January month in 10 years
- Otago – the lowest for a January month in 10 years
- Manawatu/Wanganui – the lowest for a January month in 9 years
- Taranaki – the lowest for a January month in 6 years.
Looking around the country, results were varied with some regions experiencing the highest number of properties sold in a January month for years and other regions experiencing the lowest number of properties sold in a January month for years.
This highlights how those regions with solid levels of new listings back in November and December are now benefiting from an uplift in sales volumes, whereas those with chronic low listings and total inventory shortages – such as Taranaki, Manawatu/Wanganui and Wellington – are now starting to see this impacting the market.
However, with more than 1,400 new listings coming onto the market nationally in January 2021 when compared to December 2020, and anecdotal reports that open homes and auctions are starting to look busy for February, we wouldn’t expect this pattern to continue for much longer particularly as a number of people are likely to try and purchase before the LVR restrictions come back into play.
“Summer has been incredibly strong, but some key factors are changing which will have an impact,” Century 21 New Zealand Owner Derryn Mayne adds.
“LVRs will be reinstated on 1 March, meaning a 20% deposit requirement for owner-occupiers and 30% for property investors. What’s more, later in March the mortgage holiday scheme ends which will inevitably see a rise in exit and mortgagee sales.”
“We’re now heading towards a different phase. This will include investors needing a 40% deposit from 1 May, and possibly the Government requiring them to hold their properties for longer than five years to avoid paying tax on capital gains.
“Without doubt, there’ll soon be fewer eligible buyers and possibly more stock for sale. In the meantime, many first-home buyers and investors are desperate to secure a property before the rules start changing next month. In fact, right now could prove the best time to sell,” Mayne concludes.
Looking forward to the next couple of months, we would expect sales volumes to continue at a reasonable pace, but again, as we’ve said in the past, this does rely on reasonable levels of new listings coming onto the market and will also depend on what happens with the change in Alert Levels over the coming days.
Mayne says the latest Auckland lockdown and Level 2 for the rest of the country will impact February’s transaction numbers somewhat, but those contemplating selling their properties should not be put off. Buyer demand remains hot, driven by record low interest rates.
REINZ HPI shows NZ property values hit new high in January
The REINZ House Price Index (HPI) for New Zealand, which measures the changing value of property in the market, increased 19.2% year-on-year to 3,482 a new high on the index – the highest annual percentage increase in 199 months (June 2004).
Additionally, 9 out of 12 regions had new highs on the index.
The HPI for New Zealand excluding Auckland showed house price values increased 20.4% from January 2020 to 3,518 in January 2021 a new high on the index – the highest percentage increase in 197 months (August 2004).
Auckland’s house price values increased 17.7% year-on-year to 3,436.
In January, Gisborne/Hawke’s Bay again had the highest annual growth rate in house price values with a 30.7% increase to a new record index level of 4,012. This was the first time since June 2004 that Gisborne/Hawke’s Bay had an annual percentage movement over 30% and was the first time the index for Gisborne/Hawke’s Bay has gone over the 4,000 level.
In second equal place was Manawatu/Wanganui and Wellington with a 26.0% annual increase in house price values. Wellington also reached a new high on the index of 3,717 and the 26.0% annual increase in house price values represented the largest HPI movement for Wellington on record.
Median days to sell lowest for a January month in 17 years
In January, the median number of days to sell a property nationally decreased 7 days from 42 to 35 when compared to January 2020, the lowest for a January month in 17 years.
For New Zealand excluding Auckland, the median days to sell also decreased by 7 days from 42 to 35, the lowest for a January month in 17 years.
Auckland saw the median number of days to sell a property decrease by 8 days from 43 to 35, the lowest for the month of January in 6 years.
Seven regions (Bay of Plenty, Hawke’s Bay, Manawatu/Wanganui, Northland, Taranaki, Tasman and Waikato) all had their lowest January median number of days to sell since REINZ began keeping records.
Additionally, the West Coast and Wellington had the lowest median number of days to sell in a January month in 25 and 37 days respectively.
Highest percentage of auctions for a January month since records began
January saw 16.1% of all properties sold by auction, with 796 properties selling under the hammer – up from 6.5% at the same time last year, when 312 properties were sold via auction. This was the highest percentage of auctions in a January month since records on sales methods began.
New Zealand excluding Auckland saw 9.1% of properties sold by auction, up from 3.4% in January 2020.
Gisborne had the highest percentage of auctions across the country with 32.1% (9 properties) sold under the hammer, up from 11.5% (3 properties) in January 2020.
Bay of Plenty had the second highest percentage of auctions in New Zealand with 28.9% of properties (99 properties) sold under the hammer in January up from 11.7% at the same time last year (45 properties).
In third place was Auckland with 27.6% (516 properties) sold under the hammer up from 14.3% in January 2020 (194 properties) and was the highest percentage of auctions for a January month since records on sales methods began.
Inventory levels down YOY, but up MOM
The total number of properties available for sale in New Zealand decreased by 20.6% in January to 15,480 down from 19,488 in January 2020 – a decrease of 4,008 properties compared to 12 months ago.
However, in positive news, this was an uplift on December’s inventory level which was the lowest level ever.
Not a single region had an uplift on inventory levels when compared to January 2020. Regions with the largest percentage decrease in total inventory levels were:
- Manawatu/Wanganui: -38.8% from 654 to 400 – 254 fewer properties
- Northland: -37.3% from 1,221 to 766 – 455 fewer properties
- Bay of Plenty: -36.9% from 1,230 to 776 – 454 fewer properties
- Canterbury: -36.3% from 2,928 to 1,865 – 1,063 fewer properties
- Nelson: -36.2% from 356 to 227 – 129 fewer properties.
Manawatu/Wanganui had the lowest level of inventory in the country at 4 weeks – this is the lowest level of stock since records began. Taranaki was in second place with only 5 weeks’ inventory followed by Wellington in third place with 7 weeks’ inventory; this was the first time in 6 months that Wellington hasn’t had the lowest level of inventory in the country.
West Coast and Northland had the highest number of weeks’ inventory with 21 and 15 weeks’ inventory available respectively to prospective purchasers down from 191 and 37 weeks respectively at the same time last year.
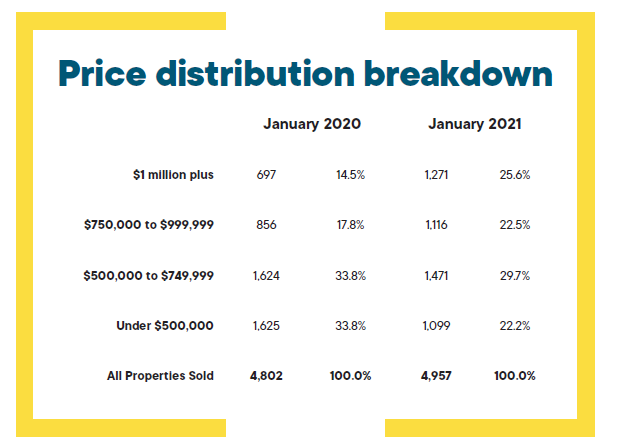
Price Bands
The number of homes sold for less than $500,000 across New Zealand fell from 33.8% of the market (1,625 properties) in January 2020 to 22.2% of the market (1,099 properties) in January 2021.
The number of properties sold in the $500,000 to $750,000 bracket fell from 33.8% (1,624 properties) to 29.7% (1,471 properties).
At the top end of the market, the percentage of properties sold for $1 million or more increased from 14.5% (697 properties) in January 2020 to 25.6% (1,271 properties) in January 2021.