


REINZ’s latest figures are a clear indication that despite intervention from the Government and the Reserve Bank, house prices will continue to skyrocket until supply catches up with demand

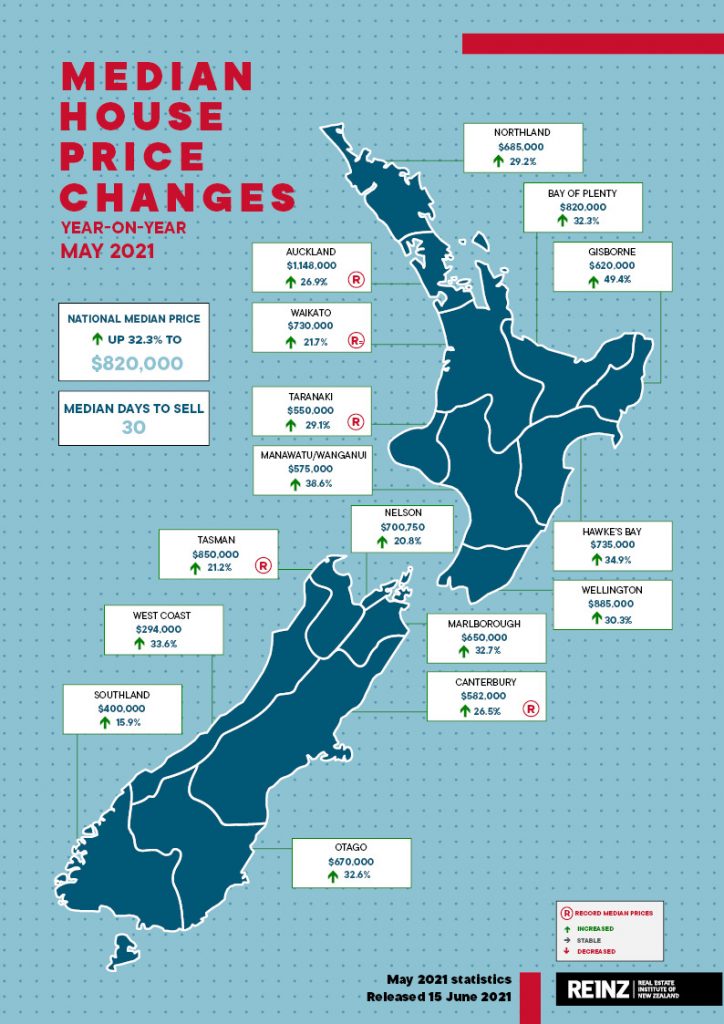
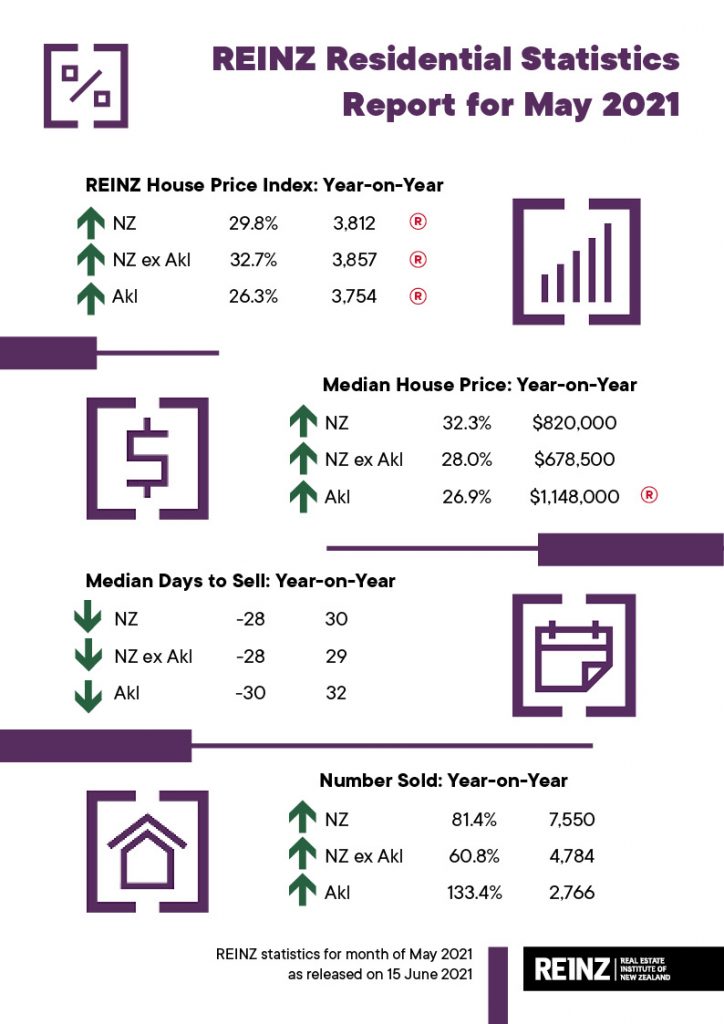
Median prices for residential property across New Zealand increased by 32.3% from $620,000 in May 2020 to $820,000 in May 2021, driven by inventory levels being at their lowest point ever. Despite this, houses continue to sell at a record rate.
The number of residential properties sold was the highest for a May month in three years, while the median number of days to sell decreased from 58 to 30 when compared to May 2020 – the lowest for a May month since records began.
“The market is still damn hot and will be until buyer demand can be met,” says Century 21 Owner, Derryn Mayne.
“Every month of strong house price statistics makes Treasury’s forecast of growth falling to 0.9% by June 2022 increasingly unlikely.
“Price growth will undoubtedly slow, and possibly to single figures, but less than 1% is not going to happen as long as the housing shortage continues, consumer confidence ticks along, and servicing a mortgage remains cheaper than paying rent,” she says.
REINZ Acting Chief Executive, Wendy Alexander says there is no denying that New Zealand’s residential property market is still holding strong.
“Median prices haven’t significantly eased yet as many had hoped would be the case, and things are certainly not getting any more affordable for first time buyers.”
Auckland’s median house price increased by 26.9% from $905,000 in May 2020 to $1,148,000 in May 2021 – another new record for Auckland. Additionally, Papakura District and Waitakere City reached new record median prices of $900,000 and $1,050,000 respectively.
The median house price for New Zealand excluding Auckland increased by 28.0% from $530,000 in May last year to $678,500 in May 2021.
In addition to Auckland, 3 other regions reached record median prices and 1 region was a record equal:
- Taranaki: with a 29.1% increase from $426,000 in May 2020 to $550,000 in May 2021. Additionally, South Taranaki District saw a new record median of $405,000
- Tasman: with a 21.2% increase from $701,500 in May 2020 to $850,000 in May 2021
- Canterbury: with a 26.5% increase from $460,000 in May 2020 to $582,000 in May 2021. Additionally, Mackenzie District ($705,000), Selwyn District ($677,500) and Waimate District ($385,000) all saw record median highs
- Waikato: with a 21.7% increase from $600,000 in May 2020 to a record equal $730,000 in May 2021. Additionally, Otorohanga District ($535,000), Taupo District ($710,000), Waikato District ($726,000) and Waitomo District ($360,000) all reached record median highs.
“Whilst we haven’t seen as many record median prices in May as we’ve seen in the past few months, with some of the regions starting to show signs of prices easing, it’s hard to know whether this is a direct result of the 23 March announcements or just the usual winter slow down,” Alexander says.
“This is particularly true given that the Auckland market is still forging ahead, with another record median price seen in May. There are now only two districts in the Auckland Region where the median house price is less than $1 million – Franklin District ($822,000) and Papakura District ($900,000).
“Auckland City remains the most expensive district in the country at $1,351,000 followed by North Shore City on $1,330,000. Even Waitakere City has now exceeded the $1 million mark with a new record of $1,050,000 in May.”
“Looking at the overall picture, we’re still seeing that the lack of total housing supply is continuing to push up house prices,” Alexander continues.
“In May, there were less than 15,000 properties available for sale across the entire country. This is the second lowest level of total inventory we’ve seen since we began collecting records, and properties are still selling relatively quickly for this time of year which is when we usually start to see things slow down a bit.”
The number of residential properties sold in May across New Zealand was the highest in a May month for 3 years with 7,550 properties sold, a 1.3% uplift from April 2021 and an 81.4% increase on May 2020.
For New Zealand excluding Auckland, 4,784 properties sold in May, just two fewer properties than sold in April 2021, but a 60.8% uplift on May 2020.
All 16 regions saw annual increases in sales volumes. Auckland saw the busiest May month in 5 years with 2,766 properties sold, a 3.7% increase on April 2021 and a 133.4% increase on May 2020. In addition to Auckland, regions with the biggest increases were:
- Tasman: +112.9% (from 31 to 66 – 35 more houses)
- West Coast: +93.8% (from 32 to 62 – 30 more houses) – the fourth-highest May sales count since records began
- Canterbury: +87.8% (from 596 to 1,119 – 523 more houses) – the highest for a May month in 14 years
- Waikato: +87.6% (from 387 to 726 – 339 more houses)
- Bay of Plenty: +75.0% (from 260 to 455 – 195 more houses).
“It’s also worth noting that some of the annual sales volume comparisons are still a little skewed by the impact of the COVID-19 Level 3 lockdown in May 2020 so it won’t be until next month that we get a clearer picture of how things are really going,” points out Alexander.
“Much of the overall growth looks to be driven by the Auckland market, as many regions have actually seen the lowest number of properties sold for a May month (excluding May 2020) for a number of years. This would suggest that the re-introduction of LVRs is having a strong influence on people’s ability to save the required deposit given how much house prices have risen of late.
“Looking forward, we would expect sales volumes to remain relatively stable over the winter months, however, if we don’t get more listings coming onto the market, it could be a very quiet winter indeed.”
The total number of properties available for sale in New Zealand decreased by 28.9% in May to 14,883 down from 20,940 in May 2020 – 6,057 fewer properties compared to 12 months ago. This is the second time that New Zealand has had less than 15,000 properties available for sale and is the second lowest level of inventory we’ve seen since records began.
For the second month in a row, only one region saw an annual uplift in inventory levels – Gisborne with a 15.0% increase in inventory levels from the same time last year (from 80 to 92 properties – 12 additional houses).
Regions with the largest percentage decrease in total inventory levels were Bay of Plenty -46.9% (from 1,417 to 753 – 664 fewer houses), Nelson -45.8% (from 395 to 214 – 181 fewer properties), West Coast -44.4% (from 304 to 169 – 135 fewer properties) and Canterbury -42.8% (from 2,800 to 1,603 – 1,197 fewer properties).
The low amount of housing stock could explain why the median number of days to sell a property nationally decreased 28 days from 58 to 30 when compared to May 2020, the lowest for a May month since records began.
For New Zealand excluding Auckland, the median days to sell decreased by 28 days from 57 to 29, also the lowest median days to sell for a May month since records began.
Auckland saw the median number of days to sell a property decrease by 30 days from 62 to 32, the lowest for the month of May in 6 years.
Eight regions across the country had a median number of days to sell of 30 or less – the first time we’ve seen this in a May month since May 2005.
Properties in Taranaki have sold at the fastest rate of any region in New Zealand, with the median number of days to sell at 24 – the fastest that properties have sold in a May month since records began. Also of note, was Manawatu/Wanganui which saw properties sell at a median rate of 26 days – also the fastest for a May month since records began.
For the first time since January 2014, Gisborne had the highest days to sell of any region at 36 days.
Nearly a third of all properties sold by auction (28.5%) – the highest percentage of auctions for a May month ever, showing that auction rooms aren’t showing the usual signs of a winter slowdown just yet.
“This growth is underpinned by some very strong results in the REINZ House Price Index (HPI), which reached a new high and represented the highest annual percentage increase in the New Zealand HPI that we’ve seen since records began,” says Alexander.
The REINZ HPI, which measures the changing value of property in the market, increased 29.8% year-on-year to 3,812 a new high on the index. This is the twelfth consecutive month that we’ve seen a new high, showing the continued strength of the market.
The HPI for New Zealand excluding Auckland showed house price values increased 32.7% from May 2020 to 3,857 in May 2021, a new high on the index and the highest percentage increase since records began.
Auckland’s house price values increased 26.3% year-on-year to 3,754 a new record high, and the highest annual percentage increase in 68 months (September 2015).
All regions bar Gisborne/Hawke’s Bay, Otago and Southland reached new highs on the index.
In May, Manawatu/Wanganui had the highest annual growth rate in house price values with a 52.1% increase to a new record index level of 4,993. This was the largest annual percentage increase in house values for the Manawatu/Wanganui region since records began and is the highest annual percentage increase any region has seen since the REINZ HPI was created.
In second place was Wellington with a 41.8% increase and in third place was Gisborne/Hawke’s Bay with a 35.6% annual increase in house price values. Wellington’s increase was the largest increase in annual house price values for the region since records began.
Properties over $1 million are still holding strong. The percentage of properties sold for $1 million or more increased from 15.3% (636 properties) in May 2020 to 34.0% (2,566 properties) in May 2021 – the second highest percentage of $1 million plus properties sold ever.
Meanwhile the number of homes sold for less than $500,000 across New Zealand fell from 33.0% of the market (1,372 properties) in May 2020 to 15.1% of the market (1,137 properties) in May 2021.
The number of properties sold in the $500,000 to $750,000 bracket fell from 33.0% (1,374 properties) to 27.9% (2,106 properties).
Mayne says given the strength of REINZ’s latest numbers, it’s time for the Government to revisit its price caps to enable more first-home buyers access to First Home Grants and Loans.
“They were lifted slightly on 1 April, but they’re still woefully inadequate which is killing the Kiwi homeownership dream for thousands. Auckland’s new caps of $625,000 for existing homes and $700,000 for new builds are already a joke. The Housing Minister now needs to take an urgent proposal to Cabinet to revise the price caps nationwide.”


