March saw the most sales in 14 years, with the national median house price soaring to a record $826,300 from $665,000 just last year, REINZ data reveals
“We’re seeing houses sell at their fastest pace in a March month ever and the highest percentage of auctions the country has ever seen since REINZ began keeping records, showing just how quickly the market is moving,” says REINZ acting Chief Executive, Wendy Alexander.
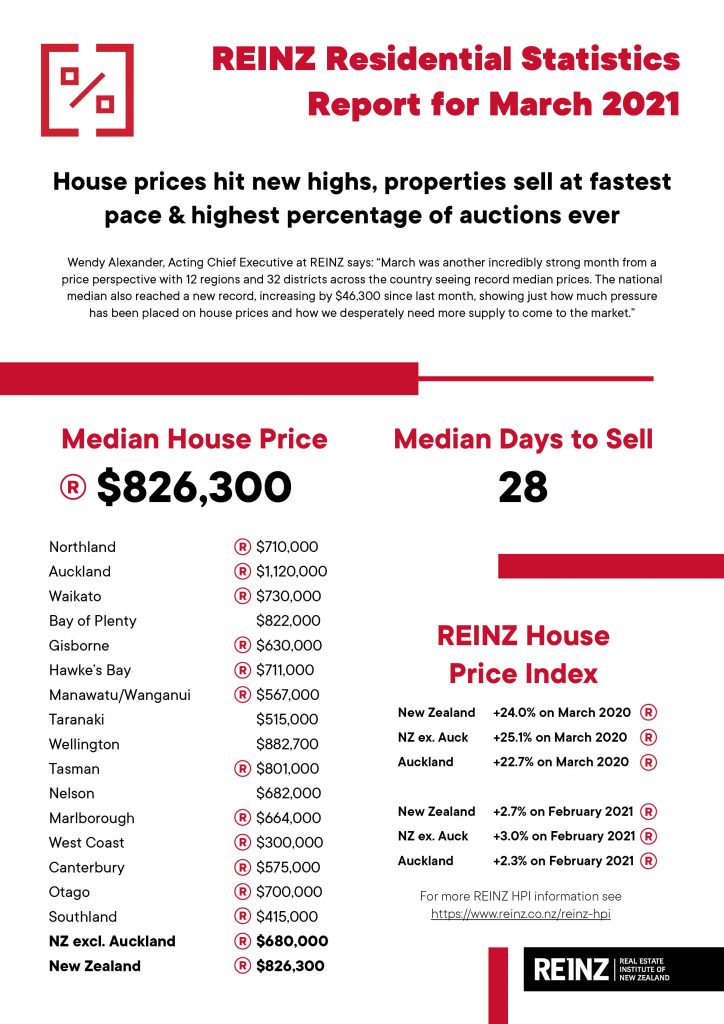
“The national median also reached a new record, increasing by $46,300 since last month, showing just how much pressure has been placed on house prices and how we desperately need more supply to come to the market.”
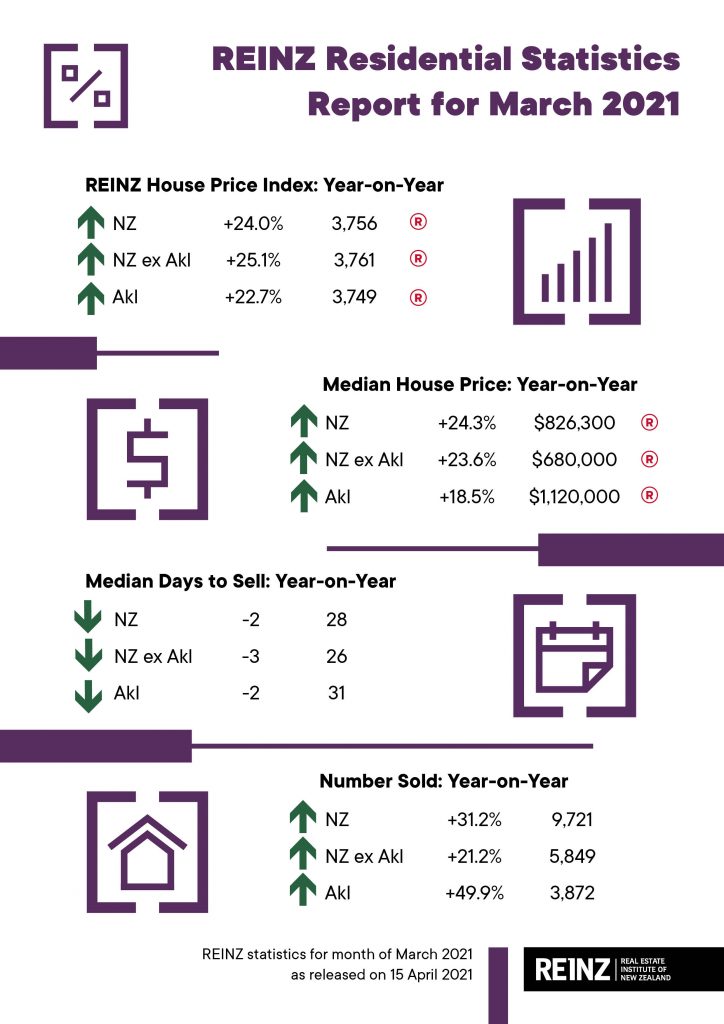
In spite of recent attempts by the Reserve Bank and the Government to cool New Zealand’s housing market, Median prices for residential property across New Zealand increased by 24.3% from $665,000 in March 2020 to $826,300 in March 2021, a new record high for the country. The median excluding Auckland increased by 23.6% from $550,000 in March last year to $680,000, also a new record high.
The number of residential properties sold in March across New Zealand increased by 31.2% when compared to the same time last year (from 7,408 to 9,721) – the highest for the month of March in 14 years and the highest annual percentage change in 3 months. For New Zealand excluding Auckland, the number of properties sold increased by 21.2% when compared to the same time last year (from 4,825 to 5,849).
The median number of days to sell a property nationally decreased 2 days from 30 to 28 when compared to March 2020, the lowest for a March month since records began. For New Zealand excluding Auckland, the median days to sell decreased by 3 days from 29 to 26, the lowest median days to sell since December 2003 and the lowest for a March month since records began.
Highlighting the continued popularity of auctions as a successful sales method, March saw more than a third of all properties sold by auction (34.0%) – the highest percentage of auctions we’ve ever seen in New Zealand. Excluding Auckland, New Zealand saw 21.8% of properties sold by auction, up from 10.0% in March 2020 – the highest percentage of auctions we’ve seen outside the Auckland region ever.
“March threw a Level 3 lockdown at Auckland, higher deposit requirements for all buyers, the Government wiping interest tax deductibility and extending the bright-line test to 10 years, and yet the market in March didn’t even blink,” says Century 21 New Zealand Owner, Derryn Mayne.
“While the impact of these measures hasn’t been reflected in the March numbers, I strongly suspect April’s numbers will be a little calmer.”
Alexander expects house prices to continue rising over the next couple of months, but hopes this will be at a slower pace than over the last 6 to 12 months.
“Hopefully the re-implementation of the LVRs, changes in government policy and the move towards winter will slow the rate of growth down a little, but only time will tell what effect they will have,” she says.
Mayne points out that from 1 May, LVR restrictions only get tougher. Property investors will be required to stump up a 40% deposit, which she says will definitely take out many ‘mums and dads’ contemplating buying a rental property.
“With interest rates still rock bottom and economic confidence reasonably positive, I’d be selling this side of winter.”
Median Price: Regional Breakdown
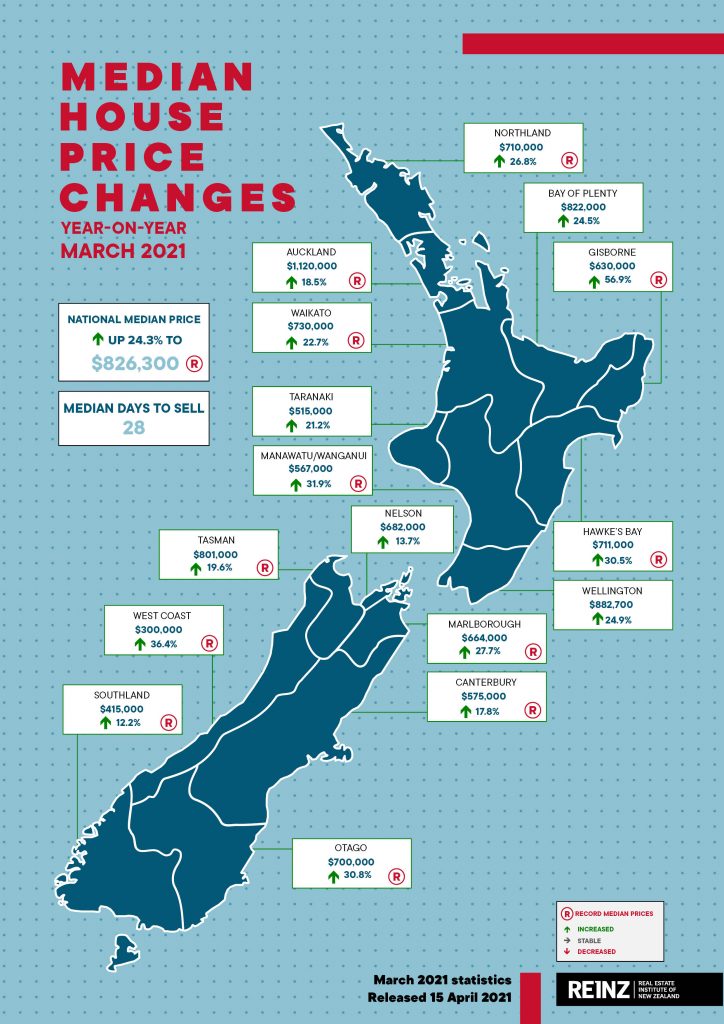
“March was another incredibly strong month from a price perspective with 12 regions and 32 districts across the country seeing record median prices,” says Alexander.
Auckland’s median house price increased by 18.5% from $945,000 in March 2020 to $1,120,000 in March 2021 – a new record for Auckland. Additionally, Auckland City, Manukau City, North Shore City, Papakura District and Rodney District all reached new record median highs.
In addition to Auckland, 11 other regions reached record median prices. They were:
- Northland: with a 26.8% increase from $560,000 in March 2020 to $710,000 in March 2021. Additionally, Whangarei ($723,000) reached a new record median price
- Waikato: with a 22.7% increase from $595,000 in March 2020 to $730,000 in March 2021. Additionally, Hamilton City ($780,000), Hauraki District ($590,000), Matamata/Piako District ($680,000), Waikato District ($720,000) and Waipa District ($801,000) all reached record median highs
- Gisborne: with a 56.9% increase from $401,618 in March 2020 to $630,000 in March 2021
- Hawke’s Bay: with a 30.5% increase from $545,000 in March 2020 to $711,000 in March 2021
- Manawatu/Wanganui: with a 31.9% increase from $430,000 in March 2020 to $567,000 in March 2021 – the ninth record median price in a row. Additionally, Horowhenua District ($575,000), Manawatu District ($565,000), Rangitikei District ($440,000) and Whanganui District ($521,000) all reached record median highs
- Tasman: with a 19.6% increase from $670,000 in March 2020 to $801,000 in March 2021
- Marlborough: with a 27.7% increase from $520,000 in March 2020 to $664,000 in March 2021
- West Coast: with a 36.4% increase from $220,000 in March 2020 to $300,000 in March 2021 – the second record median price in a row. Additionally, Grey District ($289,250) and Westland District ($405,000) were record median highs
- Canterbury: with a 17.8% increase from $488,000 in March 2020 to $575,000 in March 2021. Additionally, Christchurch City ($600,000), Timaru District ($430,000) and Waimakariri District ($565,000) all reached record median highs in March
- Otago: with a 30.8% increase from $535,000 in March 2020 to $700,000 in March 2021. Additionally, Central Otago District ($770,000), Clutha District ($400,000), Dunedin City ($650,000) and Queenstown-Lakes District ($1,185,000) all reach record median highs
- Southland: with a 12.2% increase from $370,000 in March 2020 to $415,000 in March 2021. Additionally, Invercargill District reached a record median high of $430,000.
“The Manawatu/Wanganui region has now had 9 record median prices in a row,” continues Alexander.
“10 of the last 12 months were record or equal record prices for the Waikato region, 7 of the last 8 months were records for the Canterbury region and the Auckland region has hit another record median price.
“These sorts of price rises are unsustainable and show just why New Zealand continues to top the league tables of most unaffordable nations in international studies.”
Sales: Regional Breakdown
“The number of properties sold in March was the highest we’ve seen for a March month in 14 years (March 2007), with 2,313 more properties sold when compared to March 2020 – an additional 75 properties per day,” Alexander says.
“March’s result is much higher than many commentators would have expected, as on 1 March the first tranche of the LVR restrictions came back into effect with investors requiring a 30% deposit and owner-occupiers requiring a 20% deposit.
“Therefore, we would have expected sales volumes to slow a little as buyers took this into account, however, it might just be that we need a few more months for this to really start to take effect.”
In Auckland, the number of properties sold in March increased by 49.9% year-on-year (from 2,583 to 3,872) – the highest for the month of March since records began and the second-highest number of properties sold ever, superseded only by May 2003.
In March, 12 out of 16 regions saw annual increases in sales volumes. In addition to Auckland, regions with the biggest increases were:
- West Coast: +120.0% (from 35 to 77 – 42 more houses) – the highest for a March month in 17 years
- Waikato: +42.4% (from 682 to 971 – 289 more houses) – the highest for a March month in 5 years
- Canterbury: +33.0% (from 1,027 to 1,366 – 339 more houses) – the highest for a March month in 14 years
- Nelson: +28.2% (from 78 to 100 – 22 more houses) – the highest for a March month in 3 years.
“The West Coast has now had five months in a row where we’ve seen annual increases in sales volumes in excess of 40% – the last two months alone have seen an 80.0% increase and this month it’s been a 120% increase showing how strong interest levels are in the region right now.
“Given how affordable the region is, we would expect sales volumes to continue at a strong pace for a few more months yet,” continues Alexander.
Median days to sell: Regional Breakdown
Auckland saw the median number of days to sell a property decrease by 2 days from 33 to 31, the lowest for the month of March in 6 years.
Three quarters of the country (12 regions) had a median number of days to sell of less than 30 – the first time in we’ve seen this in a March month ever.
Properties in Manawatu/Wanganui have sold at the fastest rate of any region in New Zealand, with the median number of days to sell at 20 – a record low for the region – compared to 23 days in March 2020.
Northland had the highest days to sell of any region at 35 days, albeit down from 52 days at the same time last year – the lowest for the month of March since records began.
Inventory levels
The total number of properties available for sale in New Zealand decreased by 6.1% in March to 19,437 down from 20,702 in March 2020 – 1,265 fewer properties compared to 12 months ago and 8,791 fewer properties than in March 2019.
For the first time in a couple of months, we saw more than one region see an annual uplift in inventory levels, with 7 regions seeing an increase. Gisborne had the highest increase in inventory levels, with an 8.5% increase on the same time last year (from 94 to 102 properties), followed by Otago (+7.3% from 493 to 529), Marlborough (+5.2% from 230 to 242) and Auckland (+5.1% from 7,880 to 8,282).
Regions with the largest percentage decrease in total inventory levels were the Bay of Plenty -32.9% from 1,375 to 923 – 452 fewer properties, Waikato -27.7% from 1,539 to 1,112 – 427 fewer properties and Nelson -31.4% from 369 to 253 – 116 fewer properties.
Wellington had the lowest level of inventory in the country at 6 weeks, followed by Waikato and Bay of Plenty with 7 weeks’ inventory.
Northland and West Coast had the highest number of weeks’ inventory with 28 and 23 weeks’ inventory available respectively to prospective purchasers down from 40 and 68 weeks respectively in March 2020.
Price Bands
The number of homes sold for less than $500,000 across New Zealand fell from 27.9% of the market (2,065 properties) in March 2020 to 15.3% of the market (1,489 properties) in March 2021 – the lowest percentage of properties sold in the sub-$500,000 bracket ever.
The number of properties sold in the $500,000 to $750,000 bracket fell from 32.0% (2,368 properties) to 26.7% (2,593 properties).
At the top end of the market, the percentage of properties sold for $1 million or more increased from 20.0% (1,485 properties) in March 2020 to 34.8% (3,386 properties) in March 2021 – the highest percentage of million-dollar plus properties ever sold.
REINZ HPI hits new high for tenth consecutive month in March
The REINZ House Price Index (HPI) for New Zealand, which measures the changing value of property in the market, increased 24.0% year-on-year to 3,756 a new high on the index. This is the highest annual percentage increase in the HPI that we’ve seen in 205 months (February 2004), and is the second highest on record, showing just how strong the market was in March.
The HPI for New Zealand excluding Auckland showed house price values increased 25.1% from March 2020 to 3,761 in March 2021 a new high on the index and the highest percentage increase in 202 months (May 2004).
Auckland’s house price values increased 22.7% year-on-year to 3,749 meaning house values in the City of Sails have increased by more than 270% since 2003 when the index base level was set.
Additionally, every region reached a new high on the index.
In March, Gisborne/Hawke’s Bay again had the highest annual growth rate in house price values with a 32.4% increase to a new record index level of 4,220. In second place was Manawatu/Wanganui with a 31.7% increase and in third place was Wellington with a 31.2% annual increase in house price values. Both Manawatu/Wanganui and Wellington’s increases were the largest HPI movement for the respective regions since records began.