
Real Estate Institute of New Zealand (REINZ) March 2024 data shows a significant increase in listings and stock levels, creating more options for buyers


REINZ Chief Executive Jen Baird says the market is clearly more active compared to a year ago, with high listing numbers, increased stock levels, higher sales counts, and higher median sale prices.
“Listings increased substantially, up by 23.9% nationally compared with March 2023, reinforcing a trend we have seen since the beginning of 2024 with more property coming to market. New Zealand’s stock levels also saw a year-on-year increase, which means more available properties for sale and more choices for buyers. Agents are seeing activity among a range of buyer groups, with first-home buyers and owner occupiers being the most active.”
Listings nationally increased by 23.9% year-on-year from 9,242 to 11,455; compared with February 2024, national listings decreased 2.8% from 11,788 to 11,455. Five regions, all in the North Island, saw large year-on-year increases, with Wellington up 215 listings (+32.4%), Auckland up 986 listings (+31.4%), Manawatu-Whanganui up 112 (+30.4%), Bay of Plenty up 172 listings (+28.8%), and Hawke’s Bay up 72 listings (+26.8%). Only Nelson (-2.7%) and West Coast (-1.4%) recorded decreases in listings compared with March 2023. This is the second consecutive month where North Island regions have recorded the highest year-on-year increases in listings.
New Zealand’s inventory levels have increased by 13.5% from 29,284 to 33,245 properties year-on-year – the highest level since 2015.
“Sales activity was higher in 13 of 16 regions compared to March 2023. Seven of those regions’ sales counts increased by over 10%; Gisborne led the way with the highest year-on-year increase in sales (+27.8%), reflecting a more usual level of demand, bouncing back from the low levels post the devastation of cyclones Hale and Gabrielle in early 2023.”
The total number of properties sold for New Zealand increased in March (+7.4%) compared to February 2024, from 6,073 to 6,521, and up 8.0% year-on-year, from 6,040 to 6,521. Only Northland (-1.9%) and Otago (-6.3%) recorded decreased sales activity compared with March 2023.
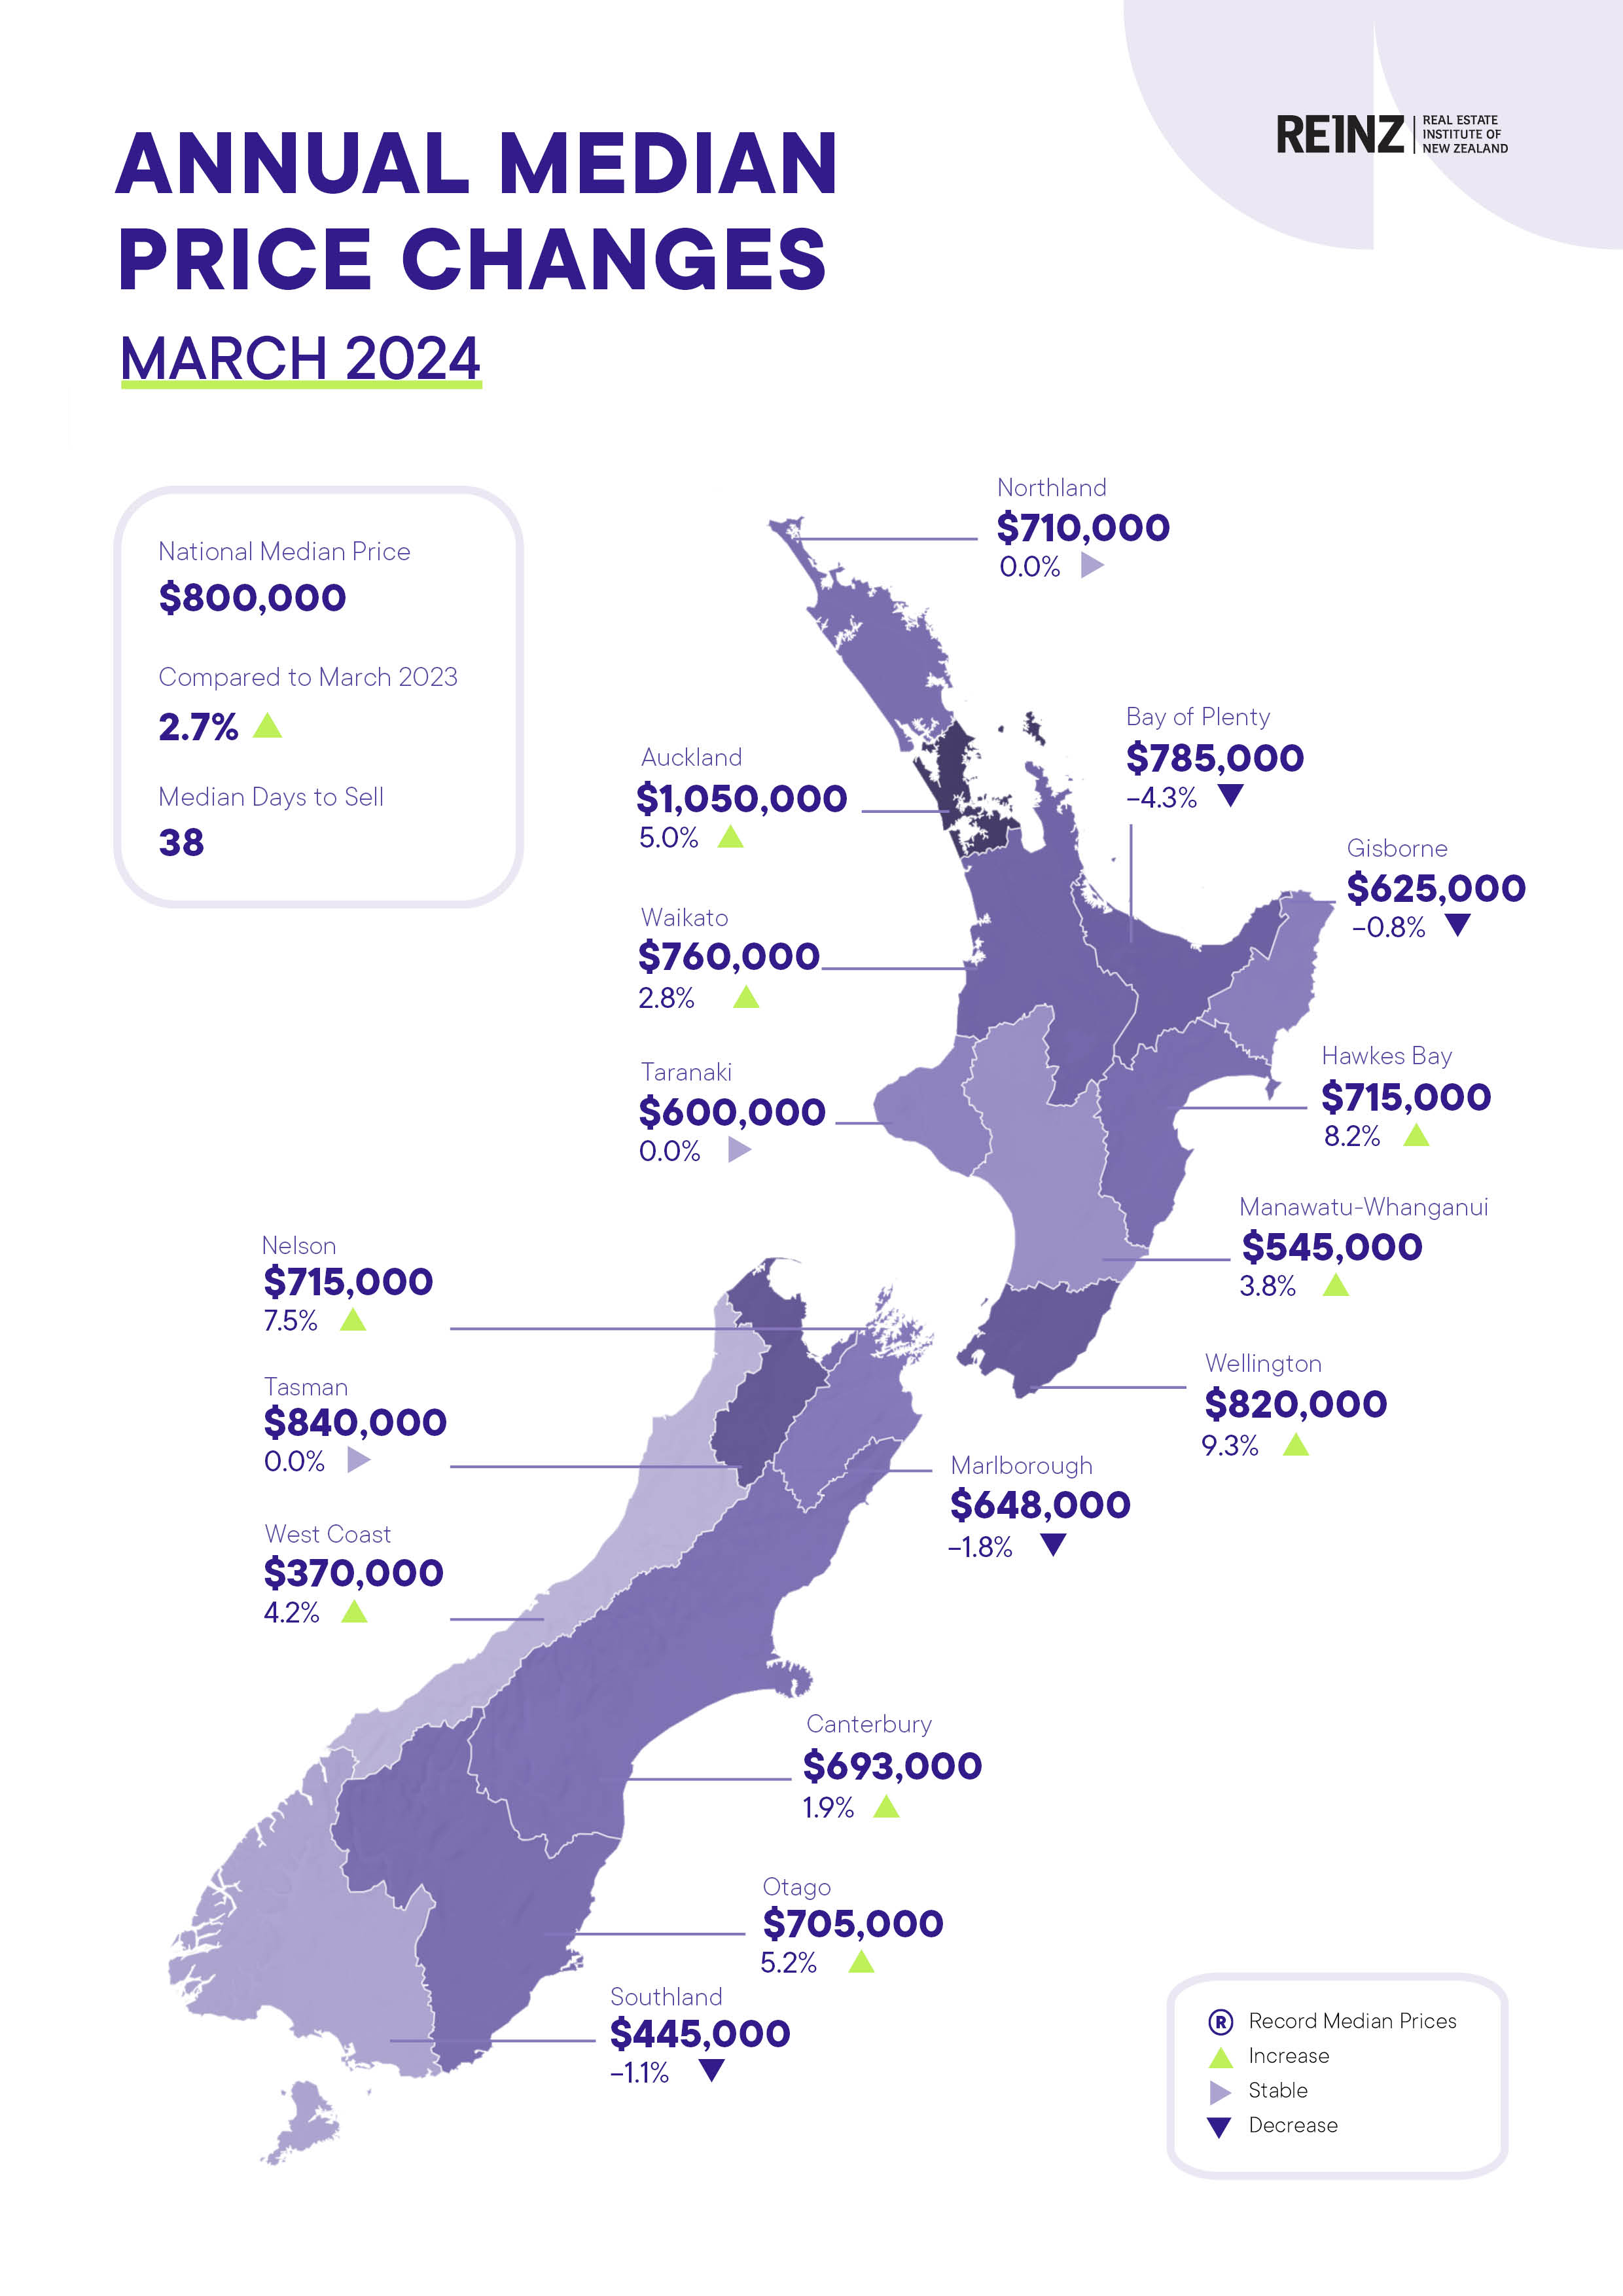
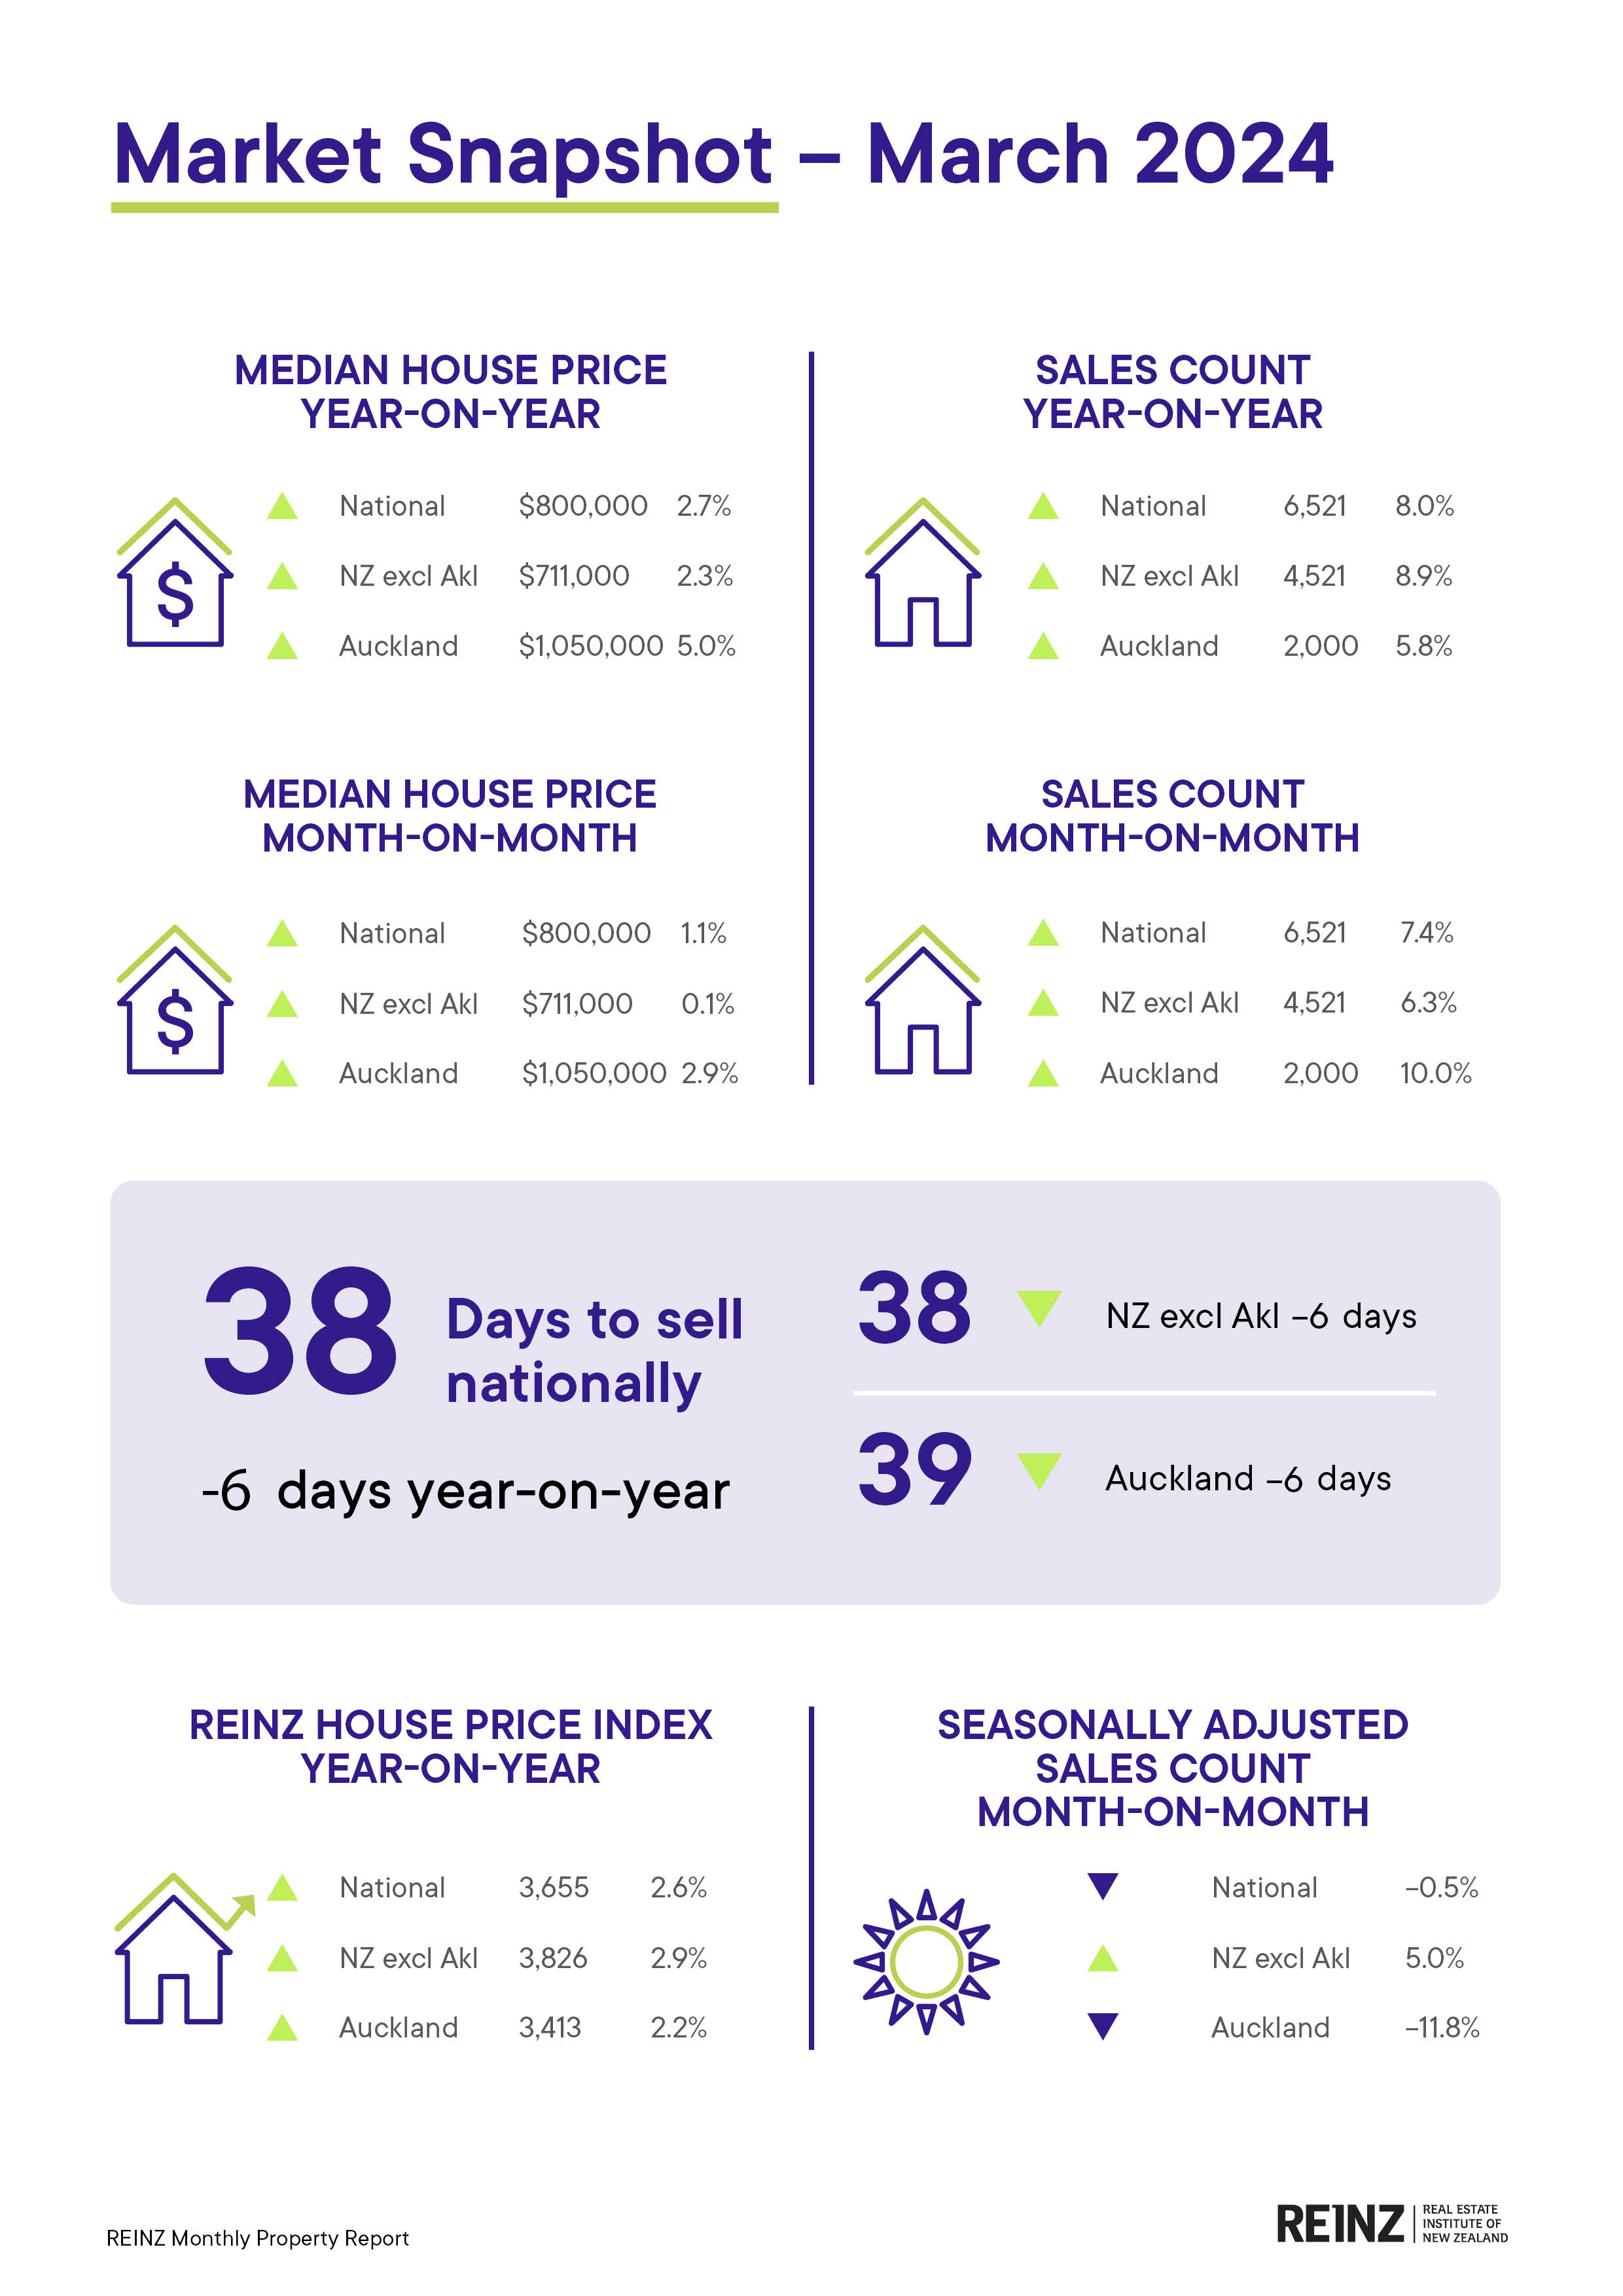
The national median sale price has increased by 2.7% from $779,000 to $800,000 year-on-year; it also increased by 1.1% from February 2024, from $791,500 to $800,000. For New Zealand, excluding Auckland, the median price also increased – it was up by 2.3% year-on-year from $695,000 to $711,000, and up by 0.1% month-on-month from $710,000 to $711,000.
“This is the second consecutive month recording a year-on-year increase in the median sale price nationally. This, along with the increased year-on-year levels of sales and listings, suggests that we are past the lowest point of this market cycle.”
Median days to sell decreased by 6 days compared to a year ago, from 44 to 38 days, both nationally and for NZ excluding Auckland. In 12 of 16 regions, median days to sell were lower compared with March 2023, with the biggest decreases in Marlborough (down 26 days), Hawke’s Bay (down 25 days), and Tasman (down 20 days).
The HPI for New Zealand stood at 3,655 in March 2024, down by 1.2% compared to the previous month and up by 2.6% for the same period last year. The average annual growth in the New Zealand HPI over the past five years has been 5.7% per annum, and it is currently 14.5% below the peak of the market reached in 2021.
Overall, the data paints a picture of the New Zealand housing market being more active, characterised by increasing listings, solid sales activity, expanding stock levels, and lifts in property prices.
“This summer has seen a return to a more normal level of real estate market activity after a relatively slow and subdued 2023. Reasons for this will vary, for example some vendors may prefer not to wait any longer and are willing to ‘meet the market’ with their price expectations. Some buyers may want to act now ahead of potential further lifts in sale prices or potential increased competition for properties, as upcoming changes to bring the bright line test back to two years, and the reintroduction of interest deductibility on investment properties, are expected to draw some investors back to the market in the next few months.
“The current economic environment with higher interest rates and some uncertainty in the jobs market will mean some buyers remain cautious, with prices still off their peaks from a couple of years ago, however growing numbers of buyers are acting now. Most agents are cautiously optimistic that market activity will continue to pick up as we move into the cooler months,” adds Baird.
Fact sheet
National highlights for March 2024
- The total number of properties sold increased in March (+7.4%) compared to February 2024 for New Zealand from 6,073 to 6,521 and increased by 8.0% year-on-year, from 6,040 to 6,521.
- The national median sale price has increased by 1.1% month-on-month from $791,500 to $800,000 and also increased by 2.7% year-on-year, from $779,000 to $800,000. New Zealand, excluding Auckland, increased month-on-month, up +0.1% from $710,000 to $711,000 and up year-on-year by 2.3% from $695,000 to $711,000.
- New Zealand’s stock levels have increased 13.5% year-on-year from 29,284 to 33,245 properties, and +5.8% month-on-month.
- Listings decreased by 2.8% from 11,788 to 11,455 nationally month-on-month, and increased by 23.9% from 9,242 to 11,455 year-on-year.
- Median Days to Sell reduced by 6 days year-on-year, down from 44.
- The HPI for New Zealand stood at 3,655 in March 2024, a 1.2% decrease compared to the previous month, and 2.6% increase for the same period last year.
Regional highlights
- In 13 of 16 regions, the year-on-year sales count was higher, and seven of those increased by over 10%. Gisborne recorded the highest year-on-year sales count, up by 27.8%.
- Nine of 16 regions had year-on-year price increases. Wellington had the highest increase, up by 9.3% compared with March 2023.
- Five regions, all in the North Island, saw large year-on-year increases in new listings, with Wellington up 215 listings (+32.4%), Auckland up 986 listings (+31.4%), Manawatu-Whanganui up 112% (+30.4%), Bay of Plenty up 172 listings (+28.8%), and Hawke’s Bay up 72 listings (+26.8%).
- Otago is the top-ranked HPI year-on-year movement this month, a position it has held for four consecutive months.
More information on activity by region can be found in the regional commentaries visit the REINZ website.
Median Prices
- Just over half (9 of 16) of the regions had year-on-year price increases, with Wellington leading the way with a 9.3% increase.
- In Auckland, four of seven TA’s had positive year-on-year median price movements with Auckland City the strongest at +10.9%, followed by North Shore City at +7.6%.
- In Wellington, seven of eight TAs had positive year-on-year median price movements with Wellington City leading the way with +12.0%, followed by Carterton District at +10.3%.
- Manawatu-Wanganui has recorded a year-on-year median price increase for the first time since May 2022 (+3.8%).
- There were no record median prices at the regional level this month.
- There were no record median prices at the TA level this month.
Sales counts
- March 2024 saw the highest sales count in:
- Gisborne since December 2021
- Wellington since November 2021
- NZ Excluding Auckland and Waikato since December 2021
- Bay of Plenty, Manawatu-Whanganui, Marlborough and Nelson since March 2022
- In terms of the month of March, March 2024 saw the lowest sales count in:
- Otago since 2011
- Northland since 2012
Median Days to Sell
- Tasman had their lowest median Days to Sell since February 2022
- In terms of the month of March, March 2024 had the highest median Days to Sell in:
- Nelson since 2011
- Taranaki since 2014
- West Coast since 2019
House Price Index (HPI)
- Ten of twelve regions (Waikato and Northland being the exceptions) had year-on-year HPI increases this month.
- Otago is the top-ranked HPI year-on-year movement this month, a position it has held for four consecutive months. Wellington is second and Canterbury is third.
- In terms of the 3 months ending HPI movement, Southland ranks first, Canterbury second and Gisborne/Hawke’s Bay third.
Inventory
- Eleven of 15 regions have had an increase in inventory in March 2024 compared to one year prior.
- Taranaki has had 29 consecutive months of year-on-year increases in inventory.
- Northland has had 24 consecutive months where their inventory has been at least 15% higher than the same month the year before.
- Conversely, Gisborne has had 12 consecutive months where their inventory has been at least 20% lower than the same month the year before.
Listings
- Thirteen of 15 regions had a year-on-year increase in listings (Nelson and West Coast being the exceptions).
- Marlborough has had 9 months in a row of year-on-year increases in Listings.
Auctions
Nationally, 17.6% (1,147) of properties were sold at auction in March 2024, compared to 11.6% (700 auctions) in March 2023.
- Gisborne had the biggest increase in auctions for March 2024, increasing 52.9% compared to February 2024.
- Auckland (+31.9%), Canterbury (+23.6%) and Bay of Plenty (20.3%) also increased their auction activity by over 20%, compared to February 2024.


