
Property prices climbed further in November and early signals suggest this growth will continue, though more moderately, according to the latest data from the Real Estate Institute of New Zealand (REINZ)


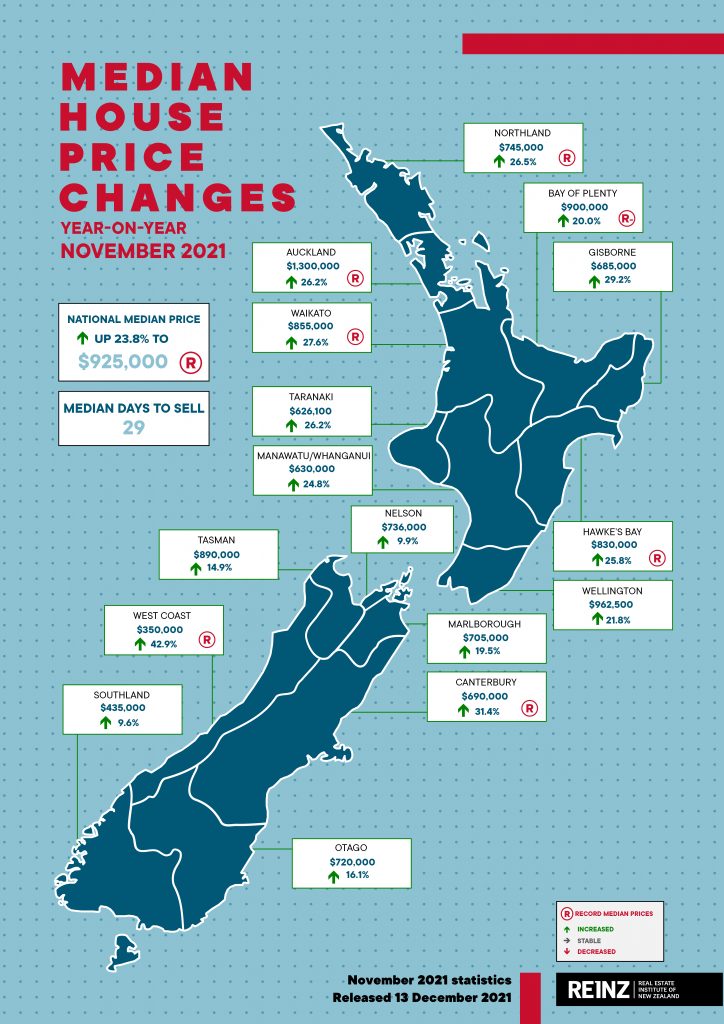
Median prices for residential property across New Zealand increased by 23.8% from $747,000 in November 2020 to $925,000 in November 2021 — a new record high. While the median house price for New Zealand excluding Auckland increased annually by 26.0% from $615,000 to a new record of $775,000.
There was a monthly increase in median prices of 3.7% across New Zealand and 3.2% for New Zealand excluding Auckland.
The median property price in Auckland increased 26.2% annually from $1,030,000 in November 2020 to $1,300,000 in November 2021 — another record median. Of the 24 territorial authorities (TAs) that had record median prices, a quarter were in Auckland. All seven Auckland districts showed an annual median price increase and six reached median highs, with only the Franklin District bucking the trend.
Auckland City increased 23.2% on last year to $1,540,000, Franklin District increased 22.0% to $980,000, Manukau City increased 28.0% to $1,235,000, North Shore City increased 26.9% to $1,555,000, Papakura District increased 51.9% to $1,173,000, Rodney District increased 30.3% to $1,310,000 and Waitakere City increased 32.3% to $1,199,000.
In addition to Auckland, the following regions reached record median prices in November:
- Northland increased 26.5% from $589,000 to $745,000 in November 2021. Additionally, Far North District ($817,500) and Kaipara District ($905,000) reached record median highs
- Waikato increased 27.6% from $670,000 to $855,000 in November 2021. Additionally, Hamilton City ($881,000), Thames-Coromandel District ($1,130,000) and Waikato District ($950,000) reached record median highs
- Hawke’s Bay increased 25.8% from $660,000 to $830,000 in November 2021. Additionally, Central Hawke’s Bay District ($660,000) and Napier City ($830,000) reached record median highs
- West Coast increased 42.9% from $245,000 to $350,000 in November 2021. Additionally, Buller District ($360,000) reached a record median high
- Canterbury increased 31.4% from $525,000 to $690,000 in November 2021. Additionally, Christchurch City ($700,500), Waimakariri District ($732,000) and Selwyn District ($870,000) reached record median highs. Selwyn District has the longest record median streak of all the TAs, with seven consecutive records.
Jen Baird, Chief Executive of REINZ, says: “The market has settled back into its stride — returning to business as near-usual across the board. November shows an active market where property prices continue to increase, stimulated by demand as New Zealand prepared to leave Alert Levels behind.
“Across New Zealand, there was an annual increase of 23.8% in median prices — with a new record high of $925,000 in November 2021 and an increase of 3.7% month-on-month. We’re seeing a firm property market, with all regions experiencing annual growth and 24 territorial authorities reaching new record medians.
“FOMO — fear of missing out — is beginning to dissipate. The enduring strength of property prices means some vendors may be less inclined to act now, without fear of missing their preferred prices later. While the supply versus demand imbalance continues to push prices upwards, across New Zealand inventory levels increased 5.1% annually and listings increased 9.0% — providing buyers more choice and giving reluctant sellers confidence that if they take their current property to market, they will be able to buy their next one.
“Despite steady growth, headwinds are gathering. Government measures to moderate the New Zealand property market, the Reserve Bank’s OCR increases and growing challenges around financing as banks tighten their lending criteria are aligning. While the longer-term impacts of these changes will play out over the coming months, the strength of the market suggests that the growth trend will continue — albeit with a more moderate trajectory,” Baird adds.
Property sales across New Zealand see monthly increase
The number of residential property sales across New Zealand decreased by 18.0% annually, from 10,220 in November 2020 to 8,381 in November 2021. However, this volume is 12.4% up on last month and the second-highest number of sales in a November month since 2006 — the highest was November 2020.
For New Zealand excluding Auckland, the number of properties sold in November 2021 decreased 17.0% annually from 6,363 to 5,279. November had the highest sales count since April 2021.
The Auckland, Canterbury, Manawatu-Whanganui, Nelson, Otago, Southland, Waikato and Wellington regions all had their highest sales count since April 2021. In Auckland, the number of properties sold decreased by 19.6% annually — from 3,857 in November 2020 to 3,102 in November 2021. There was a monthly increase of 16.0%. The rise in activity reflects a market that is rebounding. November saw an annual increase in listings of 10.4% and, following low listings in the previous months, there was a resurgence of activity, with more properties coming to market as Auckland prepared to move from Alert Level 3.
Hawke’s Bay had its highest sales count since November last year. Although sales decreased 4.8% annually from 271 to 258, they increased month-on-month by 7.1%. Gisborne marked its highest count since March 2021, with 62 properties sold — though an annual decrease of 12.7%.
The regions with the greatest annual percentage decrease in sales volumes were:
- West Coast: -48.7% from 78 to 40 — 38 fewer properties sold. There was an increase of 14.3% month-on-month
- Northland: -35.4% from 314 to 203 — 111 fewer properties and the region’s lowest November sales count since 2014. There was an increase month-on-month of 10.3%
- Tasman: -32.4% from 105 to71 — 34 fewer properties sold.
“Strong sales activity in October continued through November. Across New Zealand, sales decreased by 18.0% annually. However, there was a 12.4% increase from October 2021, proving a resilient market en route to recovery.
“Regions affected by prolonged Alert Level 3 lockdowns — Auckland, Northland and Waikato — experienced the bounce back the rest of New Zealand saw in October.
“All signals suggest that the New Zealand property market remains highly competitive, with a record median sale price, increased sales volume and a median days to sell of 29 — on par with November 2020. Anecdotally, we have heard investors are showing increased caution and first-time buyers are stepping back due to financial restraints, shifting the market focus.
“November is usually a strong month for sales. However, when we look at the seasonally adjusted sales count for November 2021, we note that many of the monthly movements were negative, which means the increase from October 2021 to November 2021 was lower in many areas than expected,” she adds.
REINZ HPI: house values reach new highs
The REINZ House Price Index (HPI) for New Zealand, which measures the changing value of all residential property in the New Zealand, showed an increase of 27.2% annually to 4,281 — reaching a new high on the index. This is now the sixteenth consecutive month we have seen a new high.
The HPI for New Zealand excluding Auckland showed an increase in house values of 28.3% from November 2020 to 4,288 in November 2021, again a new high on the index.
Auckland’s house price values increased 25.8% year-on-year to 4,272. Canterbury had its largest annual increase in HPI since records began, with a record index level of 3,861 — a 38.1% increase on November 2020. Waikato (+33.2%) and Northland (+31.0%) both saw annual HPI increases above the 30% mark.
For the first time since October 2020, Manawatu-Whanganui was not in the top two in terms of annual HPI movement. The region saw an increase in house values of 24.7% from November 2020 to 5,313 in November 2021.
Taranaki and Wellington were the only regions that did not reach new highs on the REINZ House Price Index. Southland has been in the bottom three year-on-year movements in HPI of all the regions for 10 months in a row. In November 2021, it increased 23.1% on November 2020 to 4,591.
“Across New Zealand, HPI increases have been significant and enduring over the past months. This is the first time all 12 regions have had a sustained — seven months in a row — annual increase in HPI of over 20%,” observes Baird.
Median days to sell shows properties are selling fast
In November 2021, the median number of days to sell a property across New Zealand was 29 — equal to 12-months ago. For New Zealand excluding Auckland, the median number of days to sell increased by one day from 28 in November 2020 to 29 days in 2021.
Ten regions had median days to sell of less than or equal to 30 days — the same as last month. Auckland had its lowest median days to sell since December 2020, with a median of 30 days — equal to November 2020. This figure was down 15 days from October 2021, reflecting the easing of COVID-19 response restrictions.
Properties in Canterbury sold the fastest with a median of 26 days, the region’s lowest median days to sell since 2006. Northland had its lowest median in a November month since 2005, with a median of 35 days.
Percentage of properties sold by auction increases
Across New Zealand, 32.6% of properties were sold by auction in November 2021 — compared to 26.4% in November 2020. Auctions in New Zealand excluding Auckland accounted for 21.1% of sales, up from 16.4% last year.
Gisborne again had the highest percentage of auctions, with 58.1% (36) of properties selling by auction. However, this was down from 70.4% (50) at the same time last year and suggests that other sales methods are proving attractive in the region.
Auckland, Canterbury and Waikato had the highest percentage of auctions in those regions since records began in 2005. Auctions in Auckland accounted for 52.1% (1,616) of properties sold compared to 43.0% in November 2020, and in Canterbury, 40.9% (481) of properties were sold by auction compared to 22.3% in November 2020. Waikato saw 29.4% (231) compared to 18.5% in November last year.
“While expedited by COVID-19 lockdowns, the trend towards auctions has long been at play in the New Zealand property market. Vendors increasingly see auctions as a clean and effective method of selling that provides open market transparency in an uncertain market.
“Across New Zealand, 32.6% of properties were sold by auction in November 2021 — compared to 26.4% in November 2020. Many regions have seen the percentage of auctions increase significantly, with regions such as Canterbury seeing the percentage of auctions near double. On the flipside, regions such as Gisborne — with historically high auction rates — have had a decrease. Anecdotally, we have heard of some properties being passed in at auction or renegotiated as bidding falls under the reserve price,” says Baird.
Levels of inventory increase — supply-side pressure remains
The total number of properties available for sale in New Zealand increased by 5.1% — from 18,319 in November 2020 to 19,260 in November 2021. This was the first time in months that we have seen an annual uplift in inventory levels.
Manawatu/Whanganui saw a significant annual uplift in inventory levels of 71.4% — from 430 properties in November 2020 to 737 properties in November 2021. Wellington saw a 58.3% increase on the same time last year — increasing from 874 properties to 1,384. The Hawke’s Bay region saw an increase of 48.1% — from 329 properties in November 2020 to 487 in November 2021.
Only three regions saw an annual decrease. The West Coast had the largest decrease in inventory levels, down 26.2% from 215 to 159, Northland saw an 18.9% decrease from 813 to 659, and Canterbury saw inventory levels drop 18.7% from 2,584 to 2,101.
“Inventory levels across New Zealand increased 5.1% from November 2020. Good news for buyers who will benefit from greater choice. While the uptick is welcome, when the amount of inventory is compared to the number of sales, we see eleven of the sixteen regions have 10 or less weeks of inventory available, suggesting that supply-side pressure on prices remains,” Baird concludes.
Inventory data comes from realestate.co.nz.
$1 million+ properties on the increase
In November 2021, the percentage of properties sold across New Zealand for $1 million or more increased from 27.9% in November 2020 to 43.7% in November 2021.
In Auckland, 72.9% of properties sold for over $1 million, with the majority (56.0%) sitting within the $1,000,000 to $1,999,999 bracket. In November 2020, 52.2% of properties in the region sold for $1 million or more. Wellington was the region with the second-highest percentage of properties sold for over $1 million, at 45.1%. While down on October 2021 (50.1%), this was an increase year-on-year — in November 2020, 28.9% of properties in the region breached the million mark.
The number of properties sold in the $500,000 to $750,000 bracket fell from 30.4% in November 2020 to 22.0%. While the number of properties sold for less than $500,000 dropped from 19.8% in November 2020 to 10.3% in 2021.


