
Auckland’s weakness is not so much about value bands but geography, says CoreLogic Senior Property Economist Kelvin Davidson

Auckland’s average property value has fallen by 1.5% over the past year. That isn’t a full-on downturn, but given low affordability and high levels of listings (hence plenty of buyer choice), it’s not surprising that pricing is ticking down to get some sales over the line. But within that sluggish overall picture, we’ve been asked a few times about how the various segments of the market are faring, in terms of low value versus top-end properties. Are the highest value properties dragging down the market, or is the lower end the culprit?
In fact, it’s not so much about high versus low value brackets within each area; it’s more about the areas themselves. The sluggishness of overall values has been centred in Auckland City and North Shore, with Rodney and Papakura as examples still increasing slightly. No real surprises there, given that affordability is the worst in the first two areas.
So to get stuck into the data, ever since Auckland’s market as a whole stopped rising (late 2016), it’s actually been a pretty consistent story across different parts of the city and across the value bands. Take Manukau for example, where all the value brackets have had similar growth rates in the past two years or so, albeit with lower value properties tending to outperform, as they were also doing very clearly in 2015-16 (see the first chart).
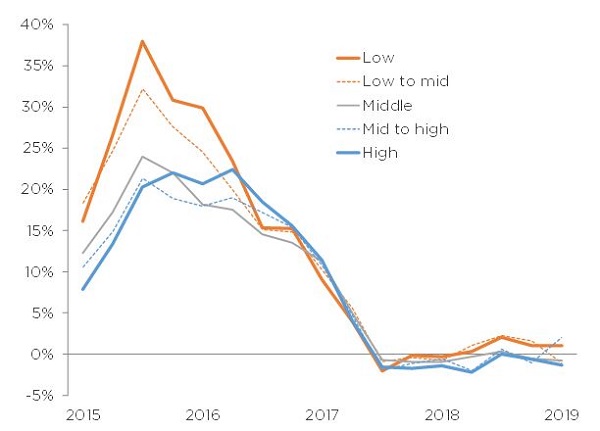
Manukau – annual % change in median value by 20% quintile value brackets (Source: CoreLogic)
North Shore has displayed a similar pattern in terms of a tight growth range across the value bands, albeit with more of those brackets now displaying price falls (see the second chart). Of course, within these value bands, there will also be greater divergences – e.g. we know from the CoreLogic QV House Price Index that some properties in North Shore Coastal are dropping more sharply.
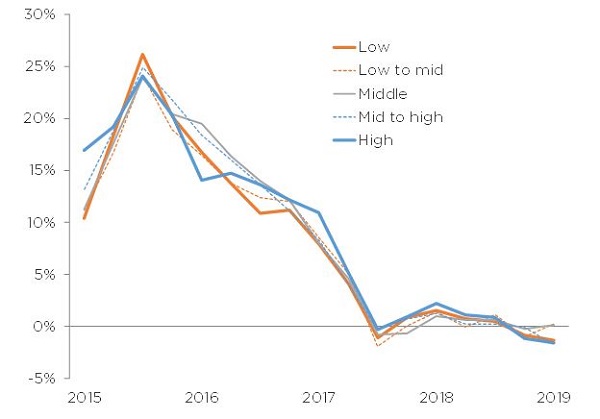
North Shore – annual % change in median value by 20% quintile value brackets (Source: CoreLogic)
Looking at things in a different way, we can cumulate the changes over the full five-year period and this reveals other interesting patterns. In Auckland City (old territorial authority area) the rises have been relatively uniform, ranging from 43% in the lowest quintile up to 48% in the highest. By contrast, in Papakura, there’s been much stronger gains for low value property (68%) versus high value (45%) – see the third chart.
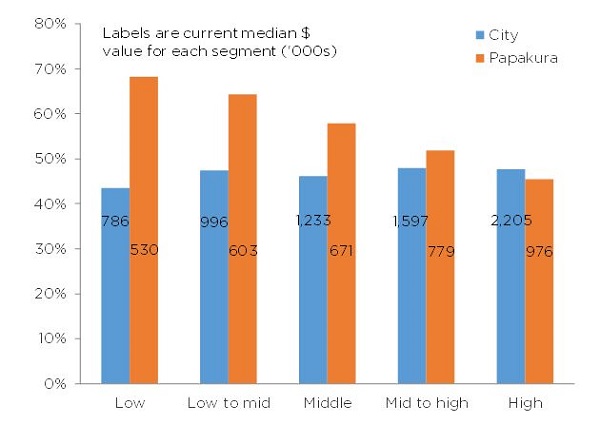
Total % change in median property values by quintile (Source: CoreLogic)
So when you look over a longer history, cheaper property within generally cheaper areas has risen more strongly than the more expensive areas (note that the median value for the low to mid band in Auckland City is $996,000, $20,000 higher than even the top band in Papakura of $976,000). Of course, that’s not surprising, given that it’s more affordable and has had some scope for ‘catch-up’ growth.
Even after that period of outperformance by lower value stock, however, the ratio of high to low values in places like Waitakere and Franklin is still much lower than Auckland City for example (see the fourth chart). In other words, there may be some room here for lower value property to continue to outperform higher value segments across much of Auckland over the coming years (even if that takes the form of only small price rises while top-end properties flat-line or tick lower).
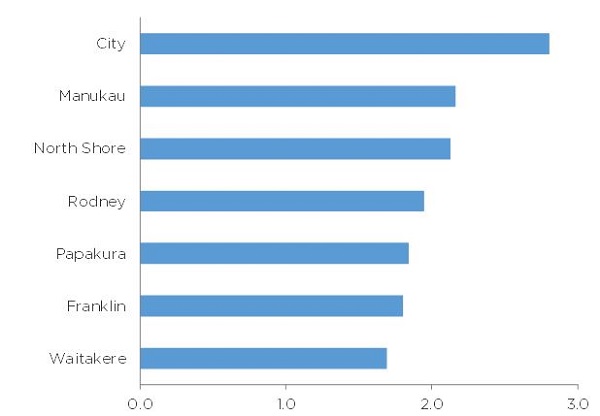
Ratio of high quintile values to low (Source: CoreLogic)
So what does this all mean? The bottom line is that Auckland’s recent weakness in overall property values isn’t so much about high versus low value property within the different areas, but more about the areas versus each other. Auckland City and North Shore are generally the weakest and are outweighing continued small rises (or flat values) in cheaper areas such as Rodney and Papakura.


