
Property values are tracking sideways according to the REINZ House Price Index (HPI). CoreLogic Head of Research Nick Goodall looks at the data at a suburb level to get the whole story

The annual rate of change dropped to +1.3% p.a., and as reported following the CoreLogic QV HPI, the NZ index is weighed down by the weakness of the Auckland market. It has diminished in value by 4.4% over the last 12 months according to the REINZ HPI.
When evaluating the Auckland index, REINZ CEO Bindi Norwell concluded “This (decrease) may be due to the fact that we’ve seen some cooling in the past few months across some areas of Auckland”.
CoreLogic Senior Property Economist Kelvin Davidson says “Auckland’s weakness is not so much about value bands but geography.”
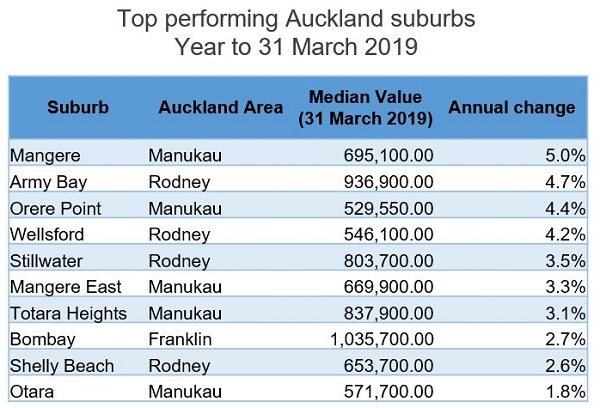
So then, where has the best and worst growth been in Auckland over the last 12 months? We can see from the first table (see above) that Mangere wins out with 5.0% growth. Not bad at a time when values are drifting backwards by 1.5% measured across the whole city. Clearly there are still active people willing and able to buy in a flat-to-dropping market. At the moment Mangere is dominated by first home buyers with 48% of all sales in 2019 going to this group.
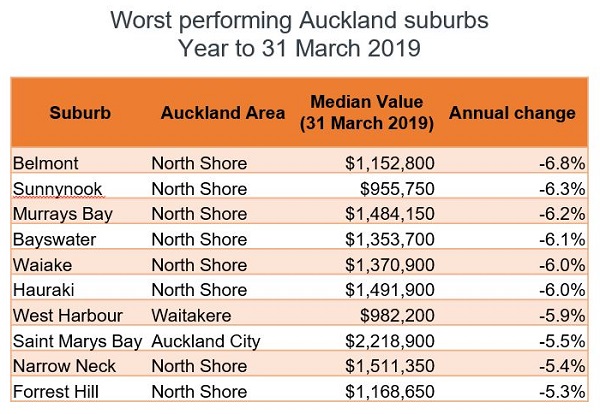
At the other end of the Auckland ‘leaderboard’ we see the North Shore dominates. In Belmont, property values have dropped 6.8% over the 12 month period analysed. This is nothing to panic about given most owners should have had equity of at least 20% when they bought, thanks to the RBNZ’s loan-to-value ratio (LVR) restrictions, but of course a noticeable drop for anyone hoping for or relying on capital growth for their investment to stack up. And investors have noticeably reduced their activity in this market.
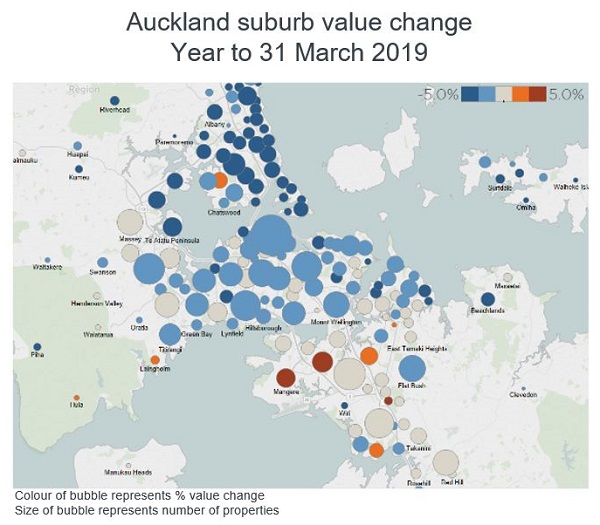
To get a quick snapshot across the city we can visualise this on a map. Here, the weakness across most of the North Shore is plain to see and pockets of growth, though sparse, are visible in South Auckland.
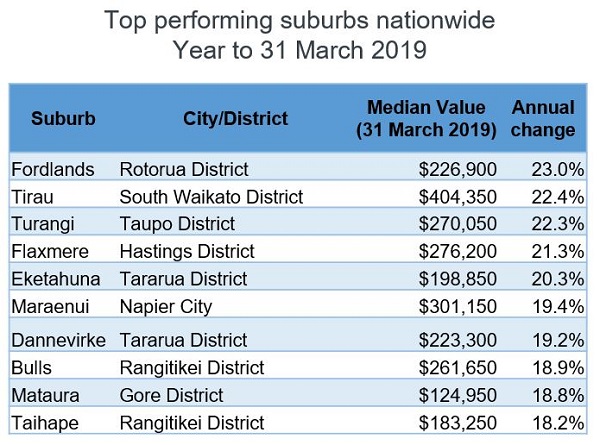
Looking outside Auckland, we get further confirmation of the strength of the regions as a whole with suburbs in Rotorua, South Waikato, Taupō, Hastings and Tararua District all experiencing growth of more than 20% over the year. The lower value of property in these places is no doubt a factor in this growth, with low interest rates keeping mortgage payments low.
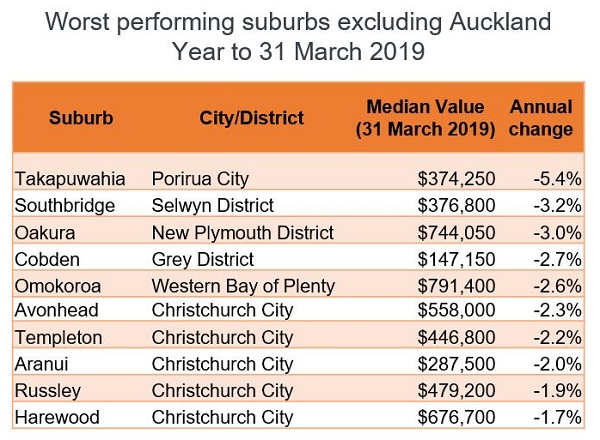
And while Auckland dominates the list of worst performing suburbs nationwide, if we exclude Auckland suburbs we see Takapuwahia in Porirua has also seen significant value erosion (-5.4% p.a.). And while no suburbs in Christchurch are in the top 5, they fill out the top 10. So while we report a minor lift in value across the city (1.3% according to the CoreLogic house price index), similar to Auckland there are pockets of both strength and weakness (mostly out west).
For a full list of the top and bottom 50 suburbs across the country click here.
Also of real interest was the continued drop in property values in the Queenstown-Lakes District. Values here have dropped 6.3% just in the past three months. This is almost certainly influenced by the Government’s ban on Foreign Buyers, introduced on 22 October 2018. Two weeks ago Statistics NZ reported that sales to non-residents/non-citizens in Queenstown had dropped from 9.7% of the total a year ago to 2.7% in the first quarter of this year. The figure did not drop to 0% as Australians and Singaporeans are excluded from the ban, while anyone investing in an apartment development with at least 20 units can also continue to buy.
Days to sell is another key measure and as the results from REINZ were seasonally typical for this time of the year. The figure flattened in Auckland (41 days) and drifted out across the rest of NZ (36 days). We expect days to sell to hover around these numbers throughout winter with a likely shortening in spring.
Winter will also bring a further reduction in sales volumes – REINZ reported a 11.5% drop in the number of sales compared to April 2018, but longer term we’re projecting volumes to improve gradually later in the year and through into 2020. This is due to the influence of the recent drop in the official cash rate, stronger-than-expected migration and the ruling out of a more comprehensive capital gains tax in sustaining demand for residential property.
While REINZ reported 5,800 sales for the month it must also be remembered those are sales involving an agent. We forecast there will be roughly 6,600 sales once all are processed by the councils. Month-to-month up to 20% of all residential sales are completed without an agent involved – at the moment however, it’s only about 12% – indicating the desire to have a professional involved in a sluggish market with reduced buyer numbers.


