
The latest data from the Real Estate Institute of New Zealand (REINZ) reports sales volumes and prices up, but for how much longer will this high last?

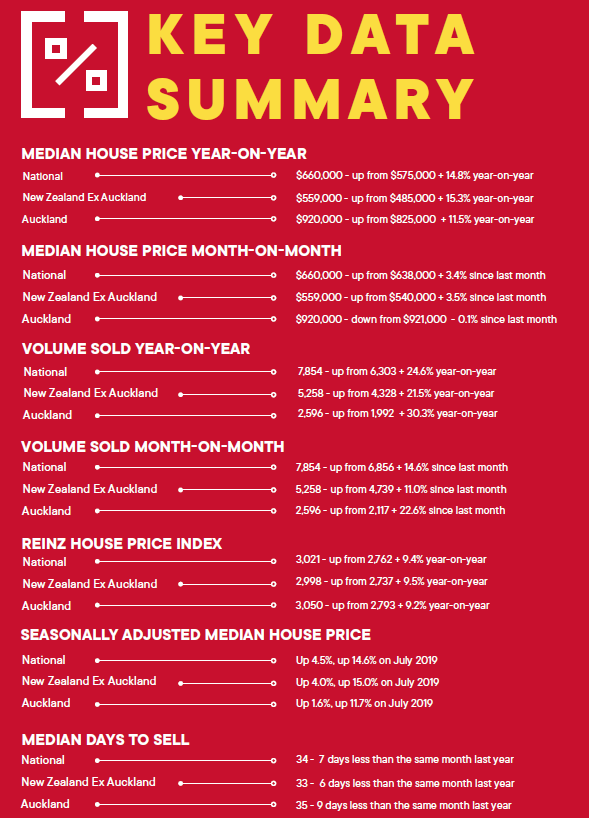
The number of residential properties sold in July across New Zealand increased by 24.6% from the same time last year (from 6,303 to 7,854). It’s the highest number of properties sold in a July month for 5 years.
For New Zealand excluding Auckland, the number of properties sold increased by 21.5% when compared to the same time last year (from 4,328 to 5,258). This is the highest for the month of July in 15 years.
In Auckland, the number of properties sold in July increased by 30.3% year-on-year (from 1,992 to 2,596) – the highest for the month of July in 5 years.
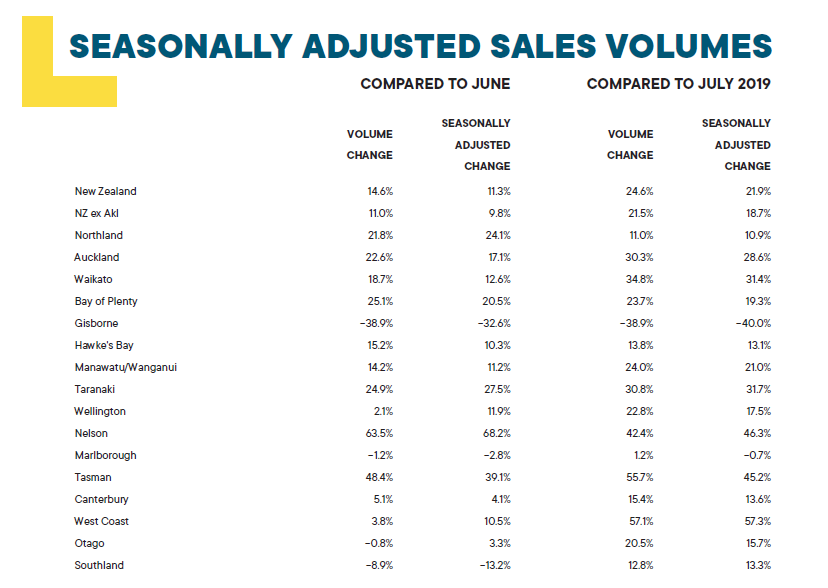
All regions, bar Gisborne and Marlborough, saw a year-on-year double-digit percentage increases in sales volumes – the first time we’ve seen this since April 2016.
Regions with the largest increase in annual sales volumes during July were:
- West Coast: 57.1% (from 35 to 55 – 20 more houses) – the highest for the month of July in 14 years
- Tasman: 55.7% (from 61 to 95 – 34 more houses) – the highest for the month of July in 18 years
- Nelson: 42.4% (from 85 to 121 – 36 more houses) – the highest for the month of July in 27 years
- Waikato: 34.8% (from 635 to 856 – 221 more houses) – the highest for the month of July in 5 years
- Taranaki: 30.8% (from 169 to 221 – 52 more houses) – the highest for the month of July in 17 years.
Chief Executive at REINZ Bindi Norwell says: “New Zealand’s property market continued to defy expectations in July with sales volumes increasing by 24.6% when compared to the same time last year. This was the largest annual percentage increase in sales volumes we’ve seen for the country since September 2015, highlighting just how confident the market was during July.
“Even though anecdotally we’ve had a great start to August, the real question now, is how long this can be sustained for? Particularly now Auckland has gone back into Level 3,” continues Norwell.
“Focusing on the July results, the only region in the country not to see an uplift in sales volumes was Gisborne, which saw the number of sales fall by 38.9% when compared to the same time last year. With just over 100 new listings coming onto the market over the last three months, and a total inventory of just 7 weeks, it’s not entirely surprising that sales have fallen in the region,” points out Norwell.
“Part of the sales volumes can be attributed to post-COVID pent up demand; but underpinning this activity during July was strong levels of interest and engagement from all buyer levels including first home buyers, investors and families looking to upgrade their property,” she says.
House prices increase YOY in every region and 4 regions see record median prices
Median house prices across New Zealand increased by 14.8% in July to $660,000, up from $575,000 in July 2019 and up from $638,000 in June (a 3.4% lift).
Median house prices for New Zealand excluding Auckland increased by 15.3% to a new record median price of $559,000, up from $485,000 in July last year and up from $540,000 in June this year.
Additionally, Auckland’s median house prices increased by 11.5% to $920,000 up from $825,000 at the same time last year, but down 0.1% from June this year.
Record median prices were achieved in:
- Waikato with a 17.1% increase to $615,000 up from $525,300 at the same time last year, and the third record median price in a row
- Gisborne with a 36.0% increase to $483,000 up from $355,099 at the same time last year
- Manawatu/Wanganui with a 19.6% increase to $442,500 up from $370,000 at the same time last year. Additionally, 3 Districts within the Manawatu/Wanganui region saw record median prices –
- Horowhenua ($450,000), Manawatu ($525,000) and Whanganui ($365,000)
- Taranaki with a 23.9% increase to $446,000 up from $360,000 at the same time last year, meaning 7 of the last 12 months were record median prices for the region.
“July marked 106 months in a row of year-on-year median prices increases for the country and every region in the country saw an increase in median house prices during the month. Additionally, New Zealand excluding Auckland and four regions – Waikato, Gisborne, Manawatu/Wanganui and Taranaki – saw record median prices achieved.
“Even Queenstown-Lakes which everyone predicted would be one of the most hard-hit regions due to a lack of international tourists saw a record median price for the District in July of $1,100,000 up from the prior record set in March 2020 of $1,080,000. It’s a similar picture in Rotorua, where median prices are up 9.4% year-on-year to $487,000. Additionally, Dunedin was predicted to be hard-hit due to a lack of investors, but median prices are up 10.8% annually to $515,000,” says Norwell.
“Other record median prices of note include Kaipara District in Northland (+119% annually to $690,000), Invercargill City (+21.1% annually to $369,500) and Kapiti Coast District (+19.2% annually to $695,000),” points out Norwell.
“Looking at Auckland, every area in the region saw a solid uplift in median prices during July compared to a year ago, and Manukau City had a record median price of $928,000 up from the prior record set in March this year of $920,000,” she continues.
“Economist and property experts across the country will be keeping an even closer eye on the housing market now we’ve moved back up the Alert Level system. If the same pattern occurs as did during the last lockdown, we would expect to see prices hold again post lockdown – although time will tell,” continues Norwell.
REINZ House Price Index (HPI) shows underlying value in the market is holding
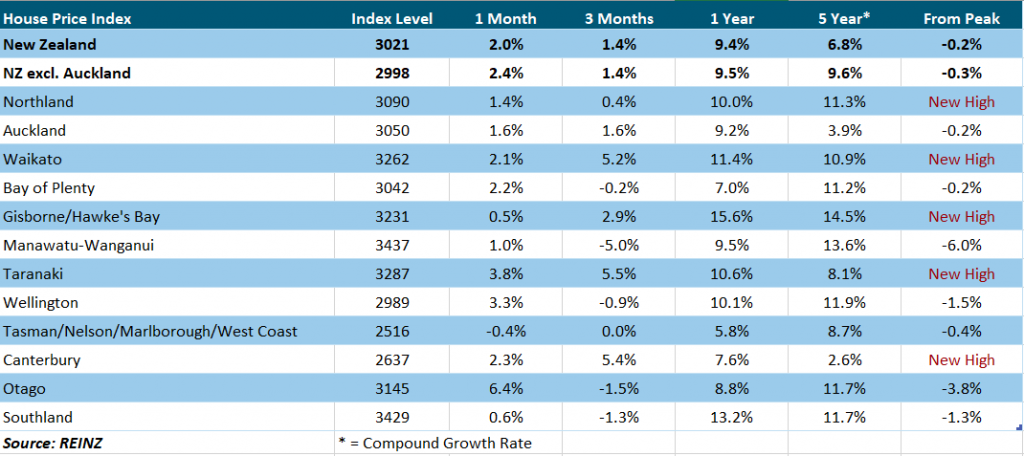
The REINZ House Price Index for New Zealand, which measures the changing value of property in the market, increased 9.4% year-on-year to 3,021.
The HPI for New Zealand excluding Auckland increased 9.5% from July 2019 to 2,998 and Auckland’s HPI increased 9.2% year-on-year to 3,050.
In July, Gisborne/Hawke’s Bay had the highest annual growth rate with a 15.6% increase to a new record index level of 3,231. In second place was Southland with an annual growth rate of 13.2% to an index level of 3,429 and in third place was Waikato with a 11.4% annual increase to a new record index level of 3,262.
This was the first time in 2 months, but only the second time in two years that Manawatu/Wanganui has not been in the top 3 for the 12-month period.
Both the 1 month and 3 month data show the underlying value in the market overall has held up with uplifts of 2.0% and 1.4% for the country respectively, despite COVID-19.
Days to sell lowest for a July month in 4 years
In July, the median number of days to sell a property nationally decreased 7 days from 41 to 34 when compared to July 2019, the lowest for the month of July in 4 years.
For New Zealand excluding Auckland, the median days to sell decreased by 6 days from 39 to 33, the lowest for the month of July in 4 years.
Auckland saw the median number of days to sell a property decrease by 9 days from 44 to 35 year-on-year, the lowest for the month of July in 4 years.
Taranaki had the lowest days to sell of all regions at 25 days – down 16 days from the same time last year and down 13 days from June. This was the lowest days to sell for Taranaki for the month of July since records began.
Manawatu/Wanganui and Southland both had the second lowest median days to sell in July with 28 days, down 3 and 8 days respectively. Manawatu/Wanganui’s figure of 28 made it the lowest median days to sell in the month of July since records began.
Although the West Coast had the highest days to sell for the country at 56 days, down 34 days on July 2019’s figure, it was the lowest days to sell for the month of July in 13 years.
Looking at the regions as a whole, 12 out of 16 regions decreased month-on-month when it came to days to sell, with the only exceptions being Hawke’s Bay (which was flat on 30 days), Otago (up 2 days to 36), Nelson (up 5 days to 39) and Gisborne (up 7 days to 37).
“To have 13 out of 16 regions with a median number of days to sell below the 40 mark in a July month is extremely unusual, showing just how quickly the market is recovering from lockdown. As we move closer to the election and as more unfolds with the latest COVID outbreak, we would expect this to slow down a bit. However, with the market appearing to do the exact opposite of what was predicted, time will tell what happens with days to sell” says Norwell
Auctions well and truly recovered post-COVID
Auctions were used in 13.8% of all sales across the country in July, with 1,085 properties selling under the hammer – up from 8.6% at the same time last year, when 539 properties were sold via auction. This was the highest percentage of auctions for the month of July in 4 years.
Gisborne had the highest percentage of auctions across the country with 48.5% (16 properties) sold under the hammer, up from 31.5% (17 properties) in July 2019.
Auckland had the second highest percentage of auctions in New Zealand with 26.8% of properties (697 properties) sold under the hammer up from 13.6% at the same time last year (270 properties). This was the highest percentage of auctions Auckland has seen for the month of July in 4 years.
In third place was Bay of Plenty with 17.3% (95 properties) sold under the hammer up from 8.6% in July 2019 (38 properties). This was the highest percentage of auctions for the month of July in 3 years.
“Every auctioneer we speak to has said how buoyant the market is right now and how unusually busy auction rooms are for this time of the year – both in terms of the number of registered bidders and people just getting a feel for where the market is at,” says Norwell.
Inventory falls for 13 months in a row
The total number of properties available for sale nationally decreased by -11.0% in July to 19,441 down from 21,843 in July 2019 – a decrease of 2,402 properties compared to 12 months ago and the lowest level of inventory for the month of July since records began.
Only 3 regions saw an annual increase in inventory levels during July – Hawke’s Bay (+17.6%), Otago (+1.0%) and Southland (+10.3%).
Regions with the largest percentage decrease in total inventory levels were:
Taranaki: -48.4% from 568 to 293 – 275 fewer properties
Marlborough: -41.0% from 293 to 173 – 120 fewer properties
Gisborne: -29.6% from 71 to 50 – 21 fewer properties.
Gisborne had the lowest number of weeks’ inventory with 7 weeks inventory available to prospective purchasers, the same as last year’s figure. This was followed by Manawatu/Wanganui and Wellington with 10 weeks’ inventory.
Northland had the highest number of week’s inventory with 44 weeks’ inventory available to prospective purchasers up from 36 weeks at the same time last year. West Coast was the next highest with 43 weeks’ inventory available, up from 41 weeks last year.
“We’re still not seeing enough new listings come to the market to meet consumer demand right now. Hopefully, this will start to change as we move towards the warmer months of the year,” concludes Norwell.
Price Bands
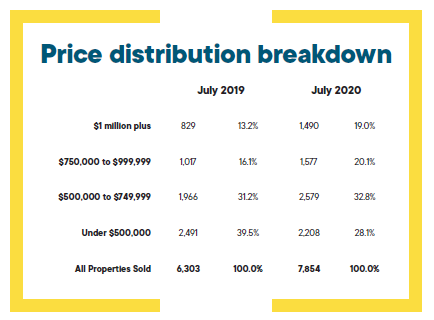
The number of homes sold for less than $500,000 across New Zealand fell from 39.5% of the market (2,491 properties) in July 2019 to 28.1% of the market (2,208 properties) in July 2020.
The number of properties sold in the $500,000 to $750,000 bracket increased from 31.2% in July 2019 (1,966 properties) to 32.8% in July 2020 (2,579 properties).
At the top end of the market, the percentage of properties sold for $1 million or more increased from 13.2% (829 properties) in July 2019 to 19.0% (1,490 properties) in July 2020 the highest percentage for a July month in 4 years.


