
Relocating owner-occupiers, or ‘movers’, have been relatively inactive over the past year or so, with upsizing, downsizing, and ‘new to area’ moves all drifting lower, CoreLogic Chief Economist Kelvin Davidson observes


The CoreLogic Buyer Classification figures suggest there’s perhaps been less of a COVID-driven hunt for extra space going on than might have been perceived. Looking ahead, movers may start to get more active again, but with mortgage rates still high, it could be a slow process.
A lot of the focus of purchaser analysis in the housing market tends to be on first home buyers, who have been faring relatively well in recent months, and mortgaged investors, who have been pretty quiet. But we shouldn’t overlook relocating owner-occupiers, or ‘movers’ as they’re labelled in the CoreLogic Buyer Classification data. This article looks at what movers have been up to, and how things might evolve in the coming period.
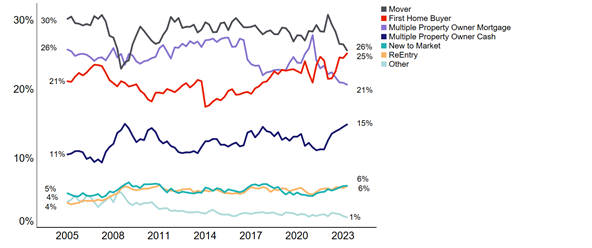
At the headline level, movers haven’t been as active compared to the long-term average. In Q2 2023, as the first chart shows, they accounted for 26% of property purchases. That was higher than first home buyers (25%), for example, but still well below the long-run movers average of 29%.
It’s not hard to find the reasons for this relative lack of activity. For a start, general market confidence levels have been low, and movers won’t have been particularly keen to relocate when they weren’t sure about how long it might take to sell their own house first and of course what price they might achieve. Difficulties in getting bridging finance have also meant that people have needed to sell before they buy, and this introduces ‘conditional offers’ and delays in housing chains.
It’s also conceivable that some households have been wanting to avoid triggering a ‘credit event’ – such as a new loan/house move, top-up, or bank switch – given the intense income and expenses checks this would involve. Instead, much of the focus has likely been on paying down existing debt and managing the progressive rise in mortgage rates.
In addition, although the available stock of listings on the market through the end of 2021 and most of 2022 has been relatively high, albeit coming down now, some of this is likely to be ‘stale stock’, and the lack of new listings has probably meant that would-be movers haven’t been able to find what they want as easily as in the past either. At the same time, there’s certainly been an increase in ‘loving not listing’, with alterations and additions activity rising.
1. NZ % share of property purchases (Source: CoreLogic)
But what about the different sub-groups within the ‘movers’ category? CoreLogic can analyse our movers data by upsizers (the new property carries a council valuation at least 10% more than the last house), downsizers (at least 10% below previous CV), or shift to a new area.
This segmentation shows upsizers have been less prominent lately. After a relative rise in activity in the two to three years prior to COVID, their overall share of property purchases has dipped since the 2020 peak (7.6%) and currently sits at around 6%.
It still takes a lot of extra money – either debt and/or equity – to trade up the housing ladder. This financial hurdle may have put some would-be upsizers off, especially when mortgage rates have been steadily increasing too.
Downsizer activity troughed in the early stages of COVID then became a more prominent feature of the market in 2021, rising from 4.6% of purchases in Q3 2020 to 6.3% in Q1 2022 (see the second chart). To some extent this goes against the perception that many households were desperately looking for more space for working from home in the post-COVID period – although no doubt that did happen in some cases. Since that early 2022 peak, the proportion of downsizer activity has drifted lower again, perhaps as house price falls have reduced the scope for people to ‘cash in’ and free up equity through moving to a smaller property.
Meanwhile, firmly in support of another perceived COVID-driven pattern over 2020-21, this data shows that ‘new to area’ moves did become more prominent, rising from about 4% of all purchases in early 2020 to a peak of 6% in Q1 2022, which was about the time that property prices started to fall. In other words, there are hints here of a hunt (at least to some degree) for ‘quieter spaces’, with more people shifting to new regions. Clearly, the normalisation of remote and hybrid working models will have helped in this regard – although since the market’s peak in late 2021, that relative share of ‘new to area’ moves has tailed off again.
So, what’s next? As buyer confidence starts to return, we suspect that the overall portion of property purchases going to movers will increase in the coming quarters – which of course may also help the flow of new listings to market. Of course, the hurdles of raising extra finance at a higher mortgage rate and serviceability test rate may mean a slow return to the market for movers.
Within that potential overall shift, it could be that both downsizing and upsizing play a role. In the case of upsizing, this may be due to some households looking to get that bigger property before any medium-term growth in house prices pushes it out of reach again. Meanwhile, downsizing could be a form of protection against mortgage stress as households that are struggling with higher repayments after repricing look to trade down and ease the strain before there’s any risk of a forced/mortgagee sale.
2. Mover sub-group % of all property purchases (Source: CoreLogic)


