While REINZ’s March 2023 report finds median prices and sales counts are easing and properties are taking longer to sell, this is not the case across the entire country, Chief Executive Jen Baird says

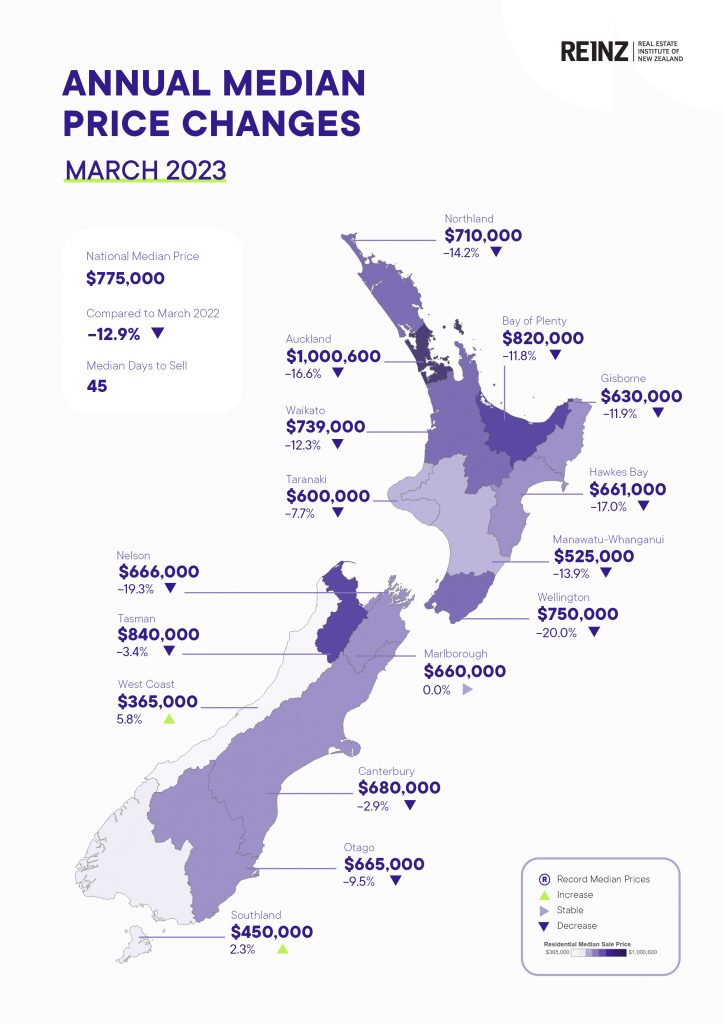
Nationally, the median price decreased 12.9% annually to $775,000 in March 2023. Days to sell have risen to 45 days for March 2023 — up 9 days compared to March 2022 and down 15 days from 60 when compared to February 2023.
However, the West Coast and Southland experienced a year-on-year median price increase.
The median price on the West Coast was $365,000 in March this year, reflecting an annual increase of 5.8%.
The West Coast was also the only region to see a decrease in its median days to sell year-on-year — down 8 days on March 2022.
West Coast salespeople say that the recent interest rate increases may help with attracting further interest to the
region as its market remains more affordable in comparison to many other regions in New Zealand.
Southland salespeople also report a lack of urgency among buyers, particularly with first home buyers and investors, though attendance at open homes has been low – largely due to continued rising interest rates, negative media coverage on the housing market and tightened lending criteria.
Despite this, sales counts are only down marginally by 0.7% compared to March 2022.
The region’s median house price this March is up 2.3% to $450,000.

National highlights
- The impact of Cyclone Gabrielle’s aftermath continues to slow activity in some affected areas.
- Median prices eased across the country by 12.9% year-on-year to $775,000. For New Zealand excluding Auckland, median prices were down 9.7% to $695,000.
- Sales counts eased across the country by 15.0% annually. The number of residential property sales across New Zealand increased month-on-month by 42.9%
- Nationally, new listings decreased by 17.7%, from 11,224 listings in March 2022 to 9,242 listings in March 2023.
- The median number of days to sell a property in March 2023 was 45— 9 days longer than in March 2022.
- The REINZ House Price Index (HPI) for New Zealand showed an annual decrease of 13.1% in the value of residential property nationwide.
- At the end of March 2023, 29,284 properties were available for sale across New Zealand — an annual increase in inventory of 14.1% for New Zealand. For New Zealand excluding Auckland, there was an annual increase of 25.6% (from 14,923 to 18,742 properties).
Regional highlights
- Whilst prices continue to ease annually in most regions, West Coast and Southland saw increases in median sale price to $365,000 and $450,000 respectively.
- Auckland had a 16.6% decrease in the median sale price for March year on year but remains just over $1m price point at $1,000,600.
- Marlborough and Taranaki were the only regions that had an increase in new listings for March year on year at 18.6% and 9.7% respectively.
- Marlborough had a 16 day increase in days to sell and was the only region to see an increase month on month and the largest year on year increase of 49 days.
Median Prices
Our two biggest cities have seen ongoing year-on-year median price declines for the beginning of 2023.
There were no record median prices at the regional or territorial authority level this month.
Sales Count
New Zealand, New Zealand excluding Auckland, Bay of Plenty, Canterbury, Manawatu-Whanganui, Marlborough, Nelson, Otago and Waikato all had the most sales this month since March 2022.
March saw the lowest sales count in:
- Taranaki since records began
- Auckland, Nelson, Tasman and Wellington since 2008
- NZ, NZ Excl. Auckland, Bay of Plenty, Marlborough, and Waikato since 2011
- Northland since 2012
- Southland since 2013
- Canterbury and Manawatu-Whanganui since 2014
- Otago and West Coast since 2020
Days to Sell
Month-on-month
All regions had a decrease in median days to sell compared to February 2023, bar Gisborne (+1 day) and Marlborough (+16 days)
March 2023* saw the highest median days to sell in Marlborough since June 2012. Nelson and Waikato recorded their lowest median days to sell since May 2022 and June 2022 respectively.
All regions had an increase in median days to sell year-on-year for March except the West Coast – down 8 days annually. At 26 days, this is the lowest median days to sell in the West Coast in a March month since 2004.
In terms of the month of March, March 2023 had the highest median Days to Sell in:
- Hawke’s Bay and Wellington since records began
- Auckland and Marlborough since 2001
- Gisborne since 2002
- New Zealand since 2009
- New Zealand excluding Auckland, Otago and Tasman since 2011
*Excluding the month of January and the two lockdown-affected months of April 2020 and May 2020
House Price Index (HPI)
The HPI measures the changing value of residential property nationwide.
Wellington has been in the bottom two ranked regions seventeen months in a row for the year-on-year HPI movement.
Bay of Plenty and Waikato had their second largest year-on-year drop in HPI since records began.
New Zealand excluding Auckland had its third-largest year-on-year drop in HPI since records began.
Southland is the top-ranked region for HPI year-on-year movement this month. Taranaki ranked second and Otago ranked third.
Inventory
Five of fifteen regions (or 33.0% of all regions) had at least a 45.0% year-on-year increase in inventory.
Three regions (Auckland, Gisborne and Wellington) had less inventory than they had one year ago.
Listings
All but two regions had had a decrease in listings since March 2022.
40% of the regions have had listings decrease by more than 15% year-on-year.
Marlborough and Taranaki were the two regions that had an increase in listings year-on-year. Marlborough increased 18.6% and Taranaki 9.7%.
Inventory and listing data come from realestate.co.nz.
Auctions
Nationally, 11.7% (688) of properties were sold at auction in March 2023, compared to 19.5% (1,352) in March 2022.
New Zealand excluding Auckland saw 7.3% of properties (296) sell by auction compared to 14.5% (651) the year prior.
More information on activity by region can be found in the regional commentaries visit the REINZ’s website.


