
As we head into the winter months, we are seeing glimpses of positivity, especially in the regions following the Reserve Bank’s announcement of easing loan-to-value restrictions and the stabilising of interest rates, REINZ Chief Executive Jen Baird says


The Real Estate Institute of New Zealand’s (REINZ) May 2023 figures show an increase in sales counts in some parts of the country while buyers and sellers in other parts continue to wait.
It’s clear that current high interest rates combined with a tight economy, are still influencing the market as buyers continue to act with caution while economic headwinds play out. This month median prices eased at a slower rate and sales counts are marginally down compared to May 2022. Seven regions increased in sales counts, an indicator of returning market confidence.
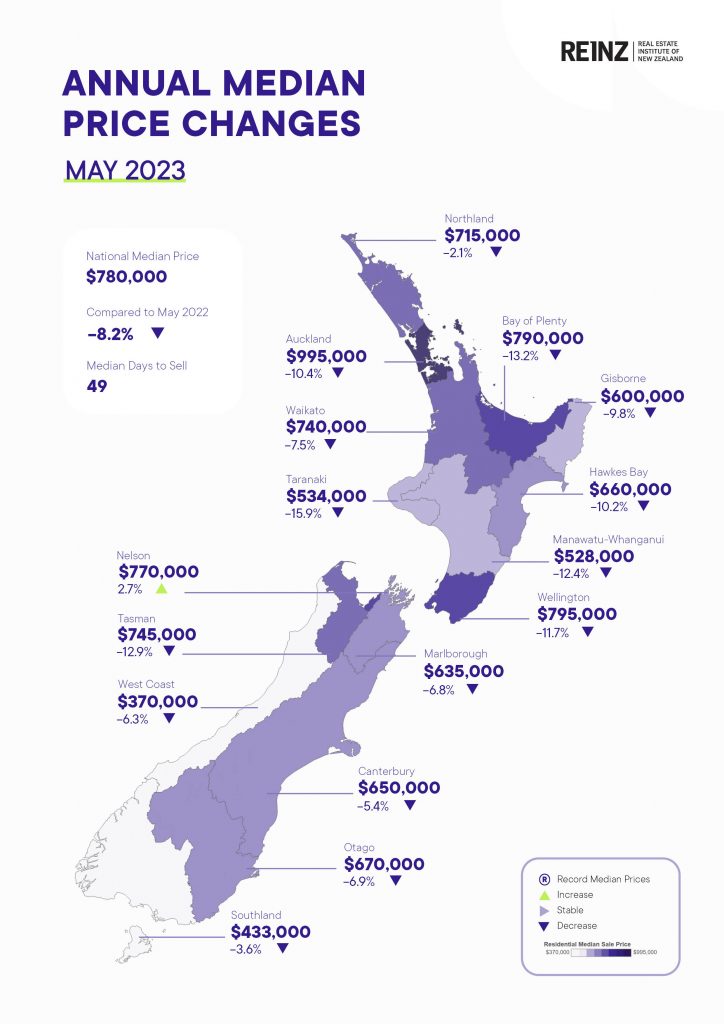
Nationally, the May 2023 median price decreased 8.2% year-on-year to $780,000 but saw no change month-on-month. The median days to sell has risen to 49 days for May 2023 — up 6 days compared to May 2022, and up 3 days from 46, when compared to April 2023. New Zealand excluding Auckland, saw a decrease in the median price of 6.5% to $685,000 and a 2.1% decrease month-on-month.
In the regions, Nelson had the biggest median price rise this month at 2.7% year-on-year and 6.9% month-on-month to $770,000. The West Coast saw another increase with a month-on-month rise of 3.1%. Two districts reached record median prices: Grey District with a 18.7% increase year on year ($400,000) and Waitomo District taking top spot with a 53.4% increase year on year ($655,000).
At the end of May, the total number of properties for sale across New Zealand was 26,685, up 250 properties (0.9%) year-on-year, and down 6.8% month-on-month. New Zealand, excluding Auckland, was also up from 15,799 to 17,015, an increase of 1,216 properties annually (+7.7%). Month-on-month, inventory decreased 7.3%.
Inventory levels look to have stabilised with only a slight increase in stock levels. We have seen low levels of property coming to market across the country for much of this year and, as sales volumes are back at more normal levels, we may be seeing the beginning of a shift in the balance of supply vs demand.
The total number of properties sold across New Zealand in May 2023 was 5,752, down from 5,776 in May 2022 (-0.4%), and up 30.0% month on month. New Zealand, excluding Auckland, sales counts increased by 1.4% year-on-year and 26.7% month-on-month.
Seven regions, Northland, Auckland, Waikato, Wellington, Tasman, Marlborough and Southland all had a 30% increase or more in sales volumes month-on-month, with Marlborough topping the list with 66.7% in sales.
We do need to consider the typical changes that occur from April to May when interpretating the monthly sales count. Of those seven regions, it was only Marlborough, Tasman and Wellington that well exceeded what would typically be expected in May 2023 based on the April 2023 sales counts.
Northland and Waikato had a slightly larger increase in sales count from last month than is typical whereas the Auckland and Southland month-on-month movements in sales count were less than what typically happens in those regions when moving from April to May.
We’ve heard from salespeople that most sellers are meeting the market while others are potentially holding tight on selling at a higher sale price, particularly if they had bought in the peak of the market. These tend to be the properties that stay on the market longer. Easing of loan-to-value restrictions, commentary around peak inflation and a renewed confidence is seeing more first home buyers seek out opportunities.
Nationally, new listings decreased by 18.1%, from 8,983 listings in May 2022 to 7,359 listings in May 2023. Compared to April 2023, listings increased by 3.0% from 7,142. For New Zealand excluding Auckland listings decreased 17.4% year-on-year from 5,801 to 4,792. Auckland’s listings were down 19.3% from 3,182 to 2,567 year-on-year, but up 2.0% on April 2023.
The REINZ House Price Index (HPI) for New Zealand which measures the changing value of residential property nationwide showed an annual decrease of -11.2% for New Zealand and a -10.0% decrease for New Zealand excluding Auckland.
National highlights
- The national median price remained unchanged at $780,000 month on month but decreased 8.2% year on year. For New Zealand excluding Auckland, the median price was down 2.1% to $685,000 month-on-month and 6.5% year on year.
- The total number of properties for sale across New Zealand increased 0.9% year-on-year, down 6.8% month-on-month.
- The total number of properties sold across New Zealand decreased 0.4% year-on-year, increasing 30.0% month-on-month.
- Nationally, new listings decreased by 18.1%, from 8,983 listings in May 2022 to 7,359 listings in May 2023.
- Median days to sell has risen to 49 days for May 2023 — up 6 days compared to May 2022 and up 3 days from 46 when compared to April 2023.
- The REINZ House Price Index (HPI) for New Zealand showed an annual decrease of 2% in the value of residential property nationwide.
Regional highlights
- Nelson saw increases in median sale price to $770,000.
- Auckland had a 10.4% decrease in the median sale price May April year-on-year and stayed under the $1m price point to $995,000.
- Seven regions had an increase in sales counts Northland, Auckland, Waikato, Wellington and Tasman, Marlborough and Southland. Marlborough (-14) and Northland (-13) had a decrease in days to sell to 49 and 60 respectively month-on-month.
Median Prices
Our two biggest cities have seen ongoing year-on-year median price declines for the beginning of 2023. Auckland’s median price again dropped under $1,000,000 for the third month running.
There were no record median prices at the regional level.
Grey District and Waitomo District saw record median prices this month.
Sales counts
Wellington has had the highest sales count since November 2021.
Marlborough, Tasman and Otago have had the highest sales count since March 2022.
Hawke’s Bay has had the highest sales count since May 2022.
In terms of the month of May, this May* saw the lowest sales count in:
- Gisborne, Manawatu-Whanganui and Nelson since records began.
- Auckland since 2008
- New Zealand, Hawke’s Bay, and Northland since 2011
- Canterbury since 2014
- Southland since 2015
In terms of the month of May, this May was the highest sales count in Tasman since 2013
*Excluding 2020 which was affected by lockdown.
Days to Sell
West Coast had the highest median days to sell since September 2022
In terms of the month of May, May 2023 had the highest median days to sell in
- Nelson since 1996
- Tasman since 2001
- Otago since 2008
- Manawatu-Whanganui since 2014
- West Coast since 2018
House Price Index (HPI)
The HPI measures the changing value of residential property nationwide.
Wellington has been in the bottom two ranked regions for nineteen months in a row for the year-on-year HPI movement.
Otago is the top-ranked HPI year-on-year movement this month; Canterbury is second and Taranaki is third.
Inventory
Six of fifteen regions had at least a 20.0% year-on-year increase in inventory.
Seven regions had less inventory than they had one year ago.
Listings
All regions had a decrease in listings since May 2023 except for Taranaki (0.5%) and Southland (40.8%), the exceptions with an increase in listings.
Eleven of fifteen regions (73%) have had listings decrease by more than 15% year on year.
Inventory and listing data come from realestate.co.nz.
Auctions
Nationally, 9.9% (569) of properties were sold at auction in May 2023, compared to 10.8% (622) in May 2022. Month-on-month there were 160 more auctions than April 2023.
New Zealand excluding Auckland saw 6.2% of properties (244) sell by auction, compared to 7.8% (304) the year prior.
Click here for full Monthly Property Report


