
REINZ’s January statistics show that while there are significantly more properties on the market, buyer activity has slowed


January is usually a slower month for the completion of sales in New Zealand and this year is no exception with 2,995 properties being sold, Real Estate Institute of New Zealand (REINZ) Chief Executive Jen Baird says.
While this is 4.9% more than January 2023, the increase in listings is a stronger indicator that the market continues to pick up. Listings increased by 10.4% nationally and 5.4% for New Zealand, excluding Auckland, year-on-year. The biggest increases in listings compared with the previous month were seen in Wellington at 148%, followed by Gisborne at 84%, Canterbury at 81%, and Auckland at 76.8%,” says Baird.
The total number of properties sold increased in January, rising by 16.0% year-on-year for New Zealand, excluding Auckland. Ten regions, including the bigger markets of Bay of Plenty, Waikato, and Northland, had higher sales counts this January compared to January 2023.
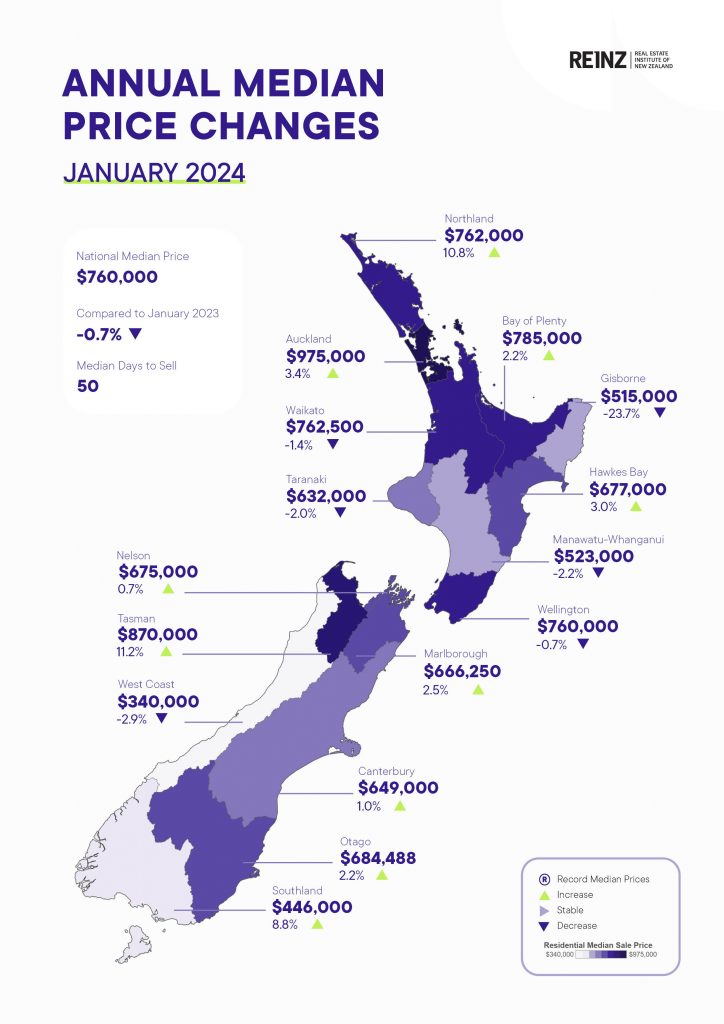
The national median sale price has slightly decreased from December 2023, down 2.5% from $779,830 to $760,000. Year-on-year, there is a slight decrease in the national median price by 0.7% from $765,000 to $760,000, while New Zealand, excluding Auckland, is down by 2.1% month-on-month (from $700,000 to $685,000) and up year-on-year by 0.8% (from $680,000 to $685,000).
The data shows regional variation in median sale prices, with Northland topping the scale with a 21% increase month-on-month from $630,000 to $762,000, and a 10.8% increase year-on-year from $687,500 to $762,000. Meanwhile, Auckland’s median sale price has fallen under the $1 million mark again this month, for the fifth time in a year, to $975,000 – however this is still 3.4% more than a year ago.
“Despite the wave of listings favouring buyers, the challenges of last year, including the cost of living, inflation, interest rate changes, and government reforms, mean some buyers remain cautious. However, most regions are reporting more buyer activity across the board, with some seeing a particular surge in first-home buyer interest. Vendors are also being confident but realistic with prices as activity increases over the summer months. This is likely to resolve in inventory moving over the coming more active months in the year, “adds Baird.
“With changes to the debt-to-income ratios coming, REINZ data will be helpful indicators for buyers to see when to buy in a developing market.”
One area of significant change that has widespread support across the property sector is the Residential Property Managers Bill. This regulation provides much-needed structure to a sector that collects rent from 670,000 tenants and manages billions of dollars in assets for everyday New Zealanders. As disincentives are removed, this is important regulation to monitor as it may change market activity, inviting investors back or to refresh their portfolios, making more housing available for those who are not in the market,” comments Baird.”
“2024 is shaping up to deliver a series of changes and shifts in dynamics for the market. The property sector is expecting the new government to make good on its promises to reduce the bright line back to two years and reintroduce interest deductibility on investment properties, changing the dynamics of the property market again.”
The HPI for New Zealand, which stood at 3,660 in January 2024, showed a 0.4% increase compared to the previous month and a 2.2% increase for the same period last year. The average annual growth in the New Zealand HPI over the past five years has been 6.0% per annum, and it is currently 14.4% below the peak of the market in 2021.
National highlights for January 2024
- The national median sale price shifted slightly month-on-month, down 2.5% from $779,830 to $760,000. Year-on-year, there is a slight decrease in the national median price of 0.7% from $765,000 to $760,000.
- The total number of properties sold across New Zealand in January 2024 increased 4.9% year-on-year to 2,995 and decreased 44.1% month-on-month from 5,357.
- The number of listings increased both nationally (+10.5%) and for New Zealand excluding Auckland (+5.4%) year-on-year. Month-on-month listings increased by 52.2% nationally.
- The total number of properties for sale has increased this month to 27,261, up from 24,867 in December 2023, a 9.6% increase. Year-on-year saw a 1.7% decrease.
- Median Days to Sell increased by 14 days month-on-month and decreased by 4 days year-on-year.
- The REINZ House Price Index (HPI) for New Zealand showed an annual increase of 2.2% in the value of residential property nationwide.
Regional highlights
- Auckland’s median sales price has dropped below the $1 million mark, shifting for the 5th time over the last year.
- Northland’s median sale price increased 21% month-on-month from $630,000 to $762,000, and increased by 10.8% year-on-year from $687,500 to $762,000.
- The biggest increases in listings were seen in Wellington at 148%, followed by Gisborne at 84%, Canterbury at 81%, and Auckland at 76.8% compared to December 2023.
Median Prices
- Over half (10 of 16) regions had year-on-year price increases with Bay of Plenty leading the way with a 45.3% increase. This is the highest number of regions with a year-on-year increase since August 2022.
- With Auckland, four of seven territorial authorities had positive year-on-year median price movements, with Rodney District the strongest at +17.1%, followed by Papakura City at +10.2%.
- With Wellington, four of eight territorial authorities had positive year-on-year median price movements, with South Wairarapa District leading the way with +21.2%, followed by Masterton District at +20.6%.
- Manawatu-Whanganui has recorded 20 consecutive months of year-on-year median price decreases for the first time since records began.
- Bay of Plenty has recorded its first year-on-year increase since August 2022.
- Hawke’s Bay has recorded its first year-on-year increase since August 2022.
Sales counts
- January 2024 saw the lowest sales count in
- Auckland, * Gisborne, * Hawke’s Bay,* Nelson* since records began.
- Tasman* since September 1999
- West Coast* since January 2016
*since the COVID lockdown affected April 2020. Aside from that month
Median Days to Sell
- Nelson had its highest median Days to Sell since July 2000
- NZ, Auckland, and Canterbury had their highest median Days to Sell since February 2023
- In terms of January, January 2024 had the highest median Days to Sell in
- Nelson since 1996
- Auckland since 2009
- Northland since 2011
- Taranaki since 2018
House Price Index (HPI)
- No regional HPI records this month.
- Eight regions had year-on-year HPI increases this month with Otago now only sitting 1.9% below its peak achieved in December 2021.
Otago is the top-ranked HPI year-on-year movement this month. Wellington is second and Southland is third.
Inventory
- Ten of 15 regions have had a decrease in inventory in January 2024 compared to one year prior.
- Northland has had 22 consecutive months where its inventory has been at least 15% higher than the same month the year before.
- Conversely, Gisborne has had 10 consecutive months where its inventory has been at least 20% lower than the same month the year before.
Listings
- Eight of the 15 regions had a year-on-year increase in listings.
- Marlborough has had 7 months in a row of year-on-year increases in listings.
- Gisborne has had 13 months in a row of year-on-year decreases in listings
Auctions
- Nationally, 6.0% (181) of properties were sold at auction in January 2024, compared to 13.7% (734) in December 2023 and 3.6% (104) compared to January 2023.
- Auckland Region saw 14.7% of properties (117) sold by auction for January 2024, a 72% increase compared to January 2023 and a 70% decrease from December 2023


