
Compared to this time last year, there has been a noticeable increase in sales in the residential property market, though the number of new listings is lagging, new REINZ figures show


The Real Estate Institute of New Zealand’s (REINZ) June 2023 figures show a renewed level of activity emerging. REINZ Chief Executive Jen Baird says June traditionally tends to be a slower month for the property market, however this month we are seeing a rise in sales counts alongside a hesitancy from sellers to list.
Compared to June 2022, this month has shown a notable increase in sales. The total number of properties sold across New Zealand in June 2023 was 5,629, up from 4,912 in June 2022 (+14.6%), year-on-year. New Zealand excluding Auckland sales counts increased by 17.4% year-on-year from 3,203 to 3,761.
At the end of June, the total number of properties for sale across New Zealand was 24,676, down 6.1% (1,595 properties) from 26,271 year-on-year, and down 7.5% month-on-month. New Zealand excluding Auckland was down from 15,820 to 15,655, a decrease of 165 properties annually.
“With sales counts up year-on-year but down slightly month-on-month, the change in direction of the national inventory level is driving ongoing lower levels of new property coming to market and an increase in the number of sales being made,” says Baird.
Historical data tells us that we typically expect a decrease in sales when moving from May to June across New Zealand. When that seasonal trend is considered, by applying seasonal adjustment to the sales count figures, we see those sales this June exceeded expectations when compared to the sales count in May 2023.
Nationally, new listings decreased by 21.2%, from 7,893 listings to 6,218 year-on-year, and a 15.5% decrease compared to May 2023 from 7,359. New Zealand excluding Auckland listings decreased 19.8% year-on-year from 4,994 to 4,005.
“Salespeople across the country are reporting increased first home buyer activity at open homes, with the easing of LVR restrictions that came into effect on 1 June bringing more people out looking. Although activity has increased, caution remains as interest rates, a pending election and further strain caused by the cost-of-living tempers putting pen on paper,” says Baird.
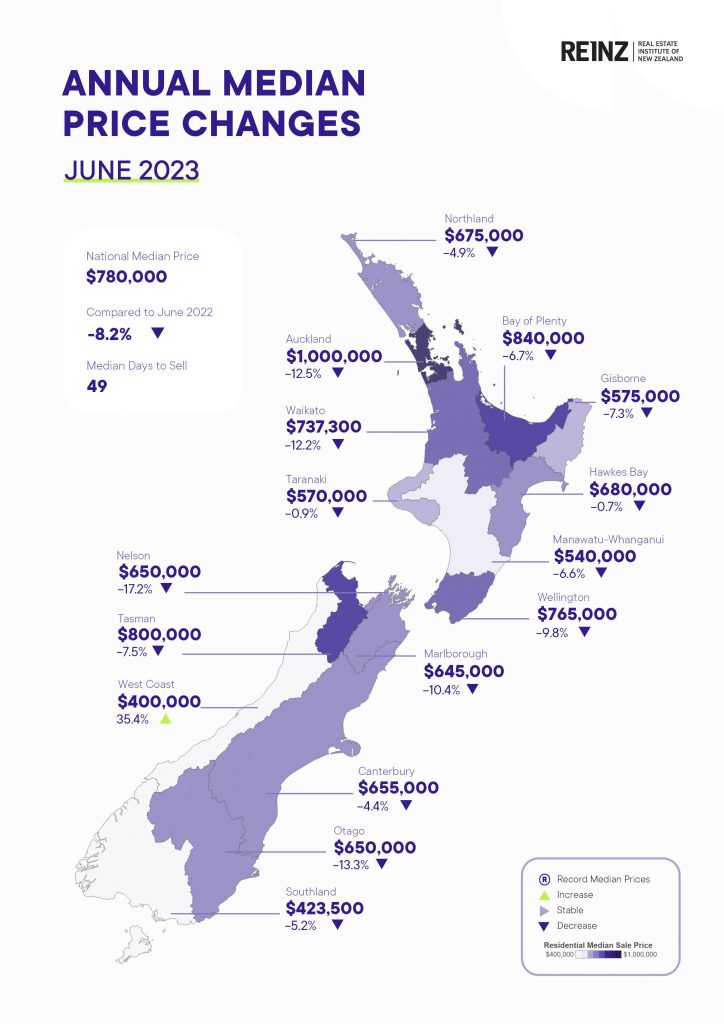
Nationally, the June 2023 median price decreased 8.2% year-on-year to $780,000 from $850,000. Days to sell have risen to 49 days for June 2023 — up 4 days compared to June 2022 and no change from May 2023. The West Coast and Tasman regions saw an annual increase in median price — up 8.1% to $400,000 and 7.4% to $800,000 respectively.
“In the last three months ending June 2023, 15,934 sales have occurred, a 1.2% increase year-on-year.
A lack of listings and the challenge of navigating the current economic climate are putting pressure on the market. Commentators say there are harder times ahead, but sales are still happening, people are still making choices about where and how they live, and these choices necessitate a property transaction,” adds Baird.
The REINZ House Price Index (HPI) for New Zealand, which measures the changing value of residential property nationwide, showed an annual decrease of -9.0% for New Zealand and a -8.0% decrease for New Zealand excluding Auckland.
National highlights
- The national median price has remained stable with a 0% change month on month and a -8.2% change year on year from $850,000 to $780,000. For New Zealand excluding Auckland, median prices were down 8.1% to $680,000.
- The total number of properties for sale across New Zealand decreased 6.1% year-on-year, and down 7.5% month-on-month.
- The total number of properties sold across New Zealand in June 2023 increased 14.6% year-on-year to 5,629, decreasing 4.1% month-on-month.
- Nationally, new listings decreased by 21.2%, from 7,893 listings in June 2022 to 6,218 listings in June 2023.
- Days to sell have remained at 49 days for June 2023 — no change from May 2023 and up 4 days from June 2022.
- When that seasonal trend is taken into account June 2023 exceeded expectations when compared to the sales count in May 2023.
- The REINZ House Price Index (HPI) for New Zealand showed an annual decrease of 9.0% in the value of residential property nationwide.
Regional highlights
- Whilst prices continue to ease annually in most regions, West Coast saw an increase in median sale price, increasing 35.4% from $295,500 to $400,000.
- Auckland increased 0.8% month-on-month in the median sale price, reaching the $1m price point, but decreased 12.5% year on year.
- Two regions (Hawke’s Bay and Southland) had a decrease in the median days to sell.
- West Coast had the highest annual increase in median days (+28 days).
Median Prices
Our two biggest cities have seen ongoing year-on-year median price declines for the beginning of 2023.
There were no record median prices at the regional level.
West Coast was the only region to have a median price increase year on year.
There were no record median prices at the regional level this month.
There were no Territorial Authority record median prices this month, the first time this has happened in the month of June since 2011.
Three quarters (75%) of all Territorial Authorities have had no median record price in any of the past 12 months
Sales counts
Historical data tells us that we typically expect a decrease in sales when moving from May to June. When that seasonal trend is taken into account by applying seasonal adjustment to the sales count figures, we see those sales this June exceeded expectations when compared to the sales count in May 2023.
Five regions had increases in sales counts month-on-month from May 2023 to June 2023.
The average number of sales in the past 10 years for the month of June is 6,506.
Days to Sell
Over the last ten years the average of the median days to sell for the month of June is 38 days.
West Coast had the highest median Days to Sell since September 2022
Southland had the lowest median Days to Sell since November 2022
In terms of the month of June, June 2023 had the highest median Days to Sell in
- Nelson since 1999
- NZ since 2008
- Otago since 2009
- NZ Excl. Auckland, and Wellington since 2011
- Tasman since 2012
- Gisborne, Manawatu-Whanganui and Taranaki since 2014
- Marlborough since 2015
House Price Index (HPI)
No regional HPI records this month.
Wellington, for the first time in 19 months, is not in the bottom two ranked regions for the YOY HPI movement.
Southland is the top-ranked HPI year-on-year movement this month. Otago is second and Taranaki is third.
Inventory
Six of fifteen regions had at least a 10% YOY increase in inventory.
Seven regions had less inventory than they had one year ago.
All regions had a decrease in Listings since June 2023 except for Northland, a notable exception with a 19.0% increase in listings.
Eight of fifteen regions have had listings decrease by more than 20% year on year.
Auctions
Nationally, 9.8% (549) of properties were sold at auction in June 2023, compared to 11.7% (575) in June 2022.
New Zealand excluding Auckland saw 6.6% of properties (250) sell by auction compared to 9.1% (290) the year prior.


