
REINZ’s September 2023 figures show more activity in the spring property market, with prices stabilising, sales counts rising and properties selling in fewer days, Chief Executive Jen Baird says


September shows the ‘green shoots’ from previous months are continuing to grow. Confidence is emerging in the property market, and we are seeing signs of an upward trend.”
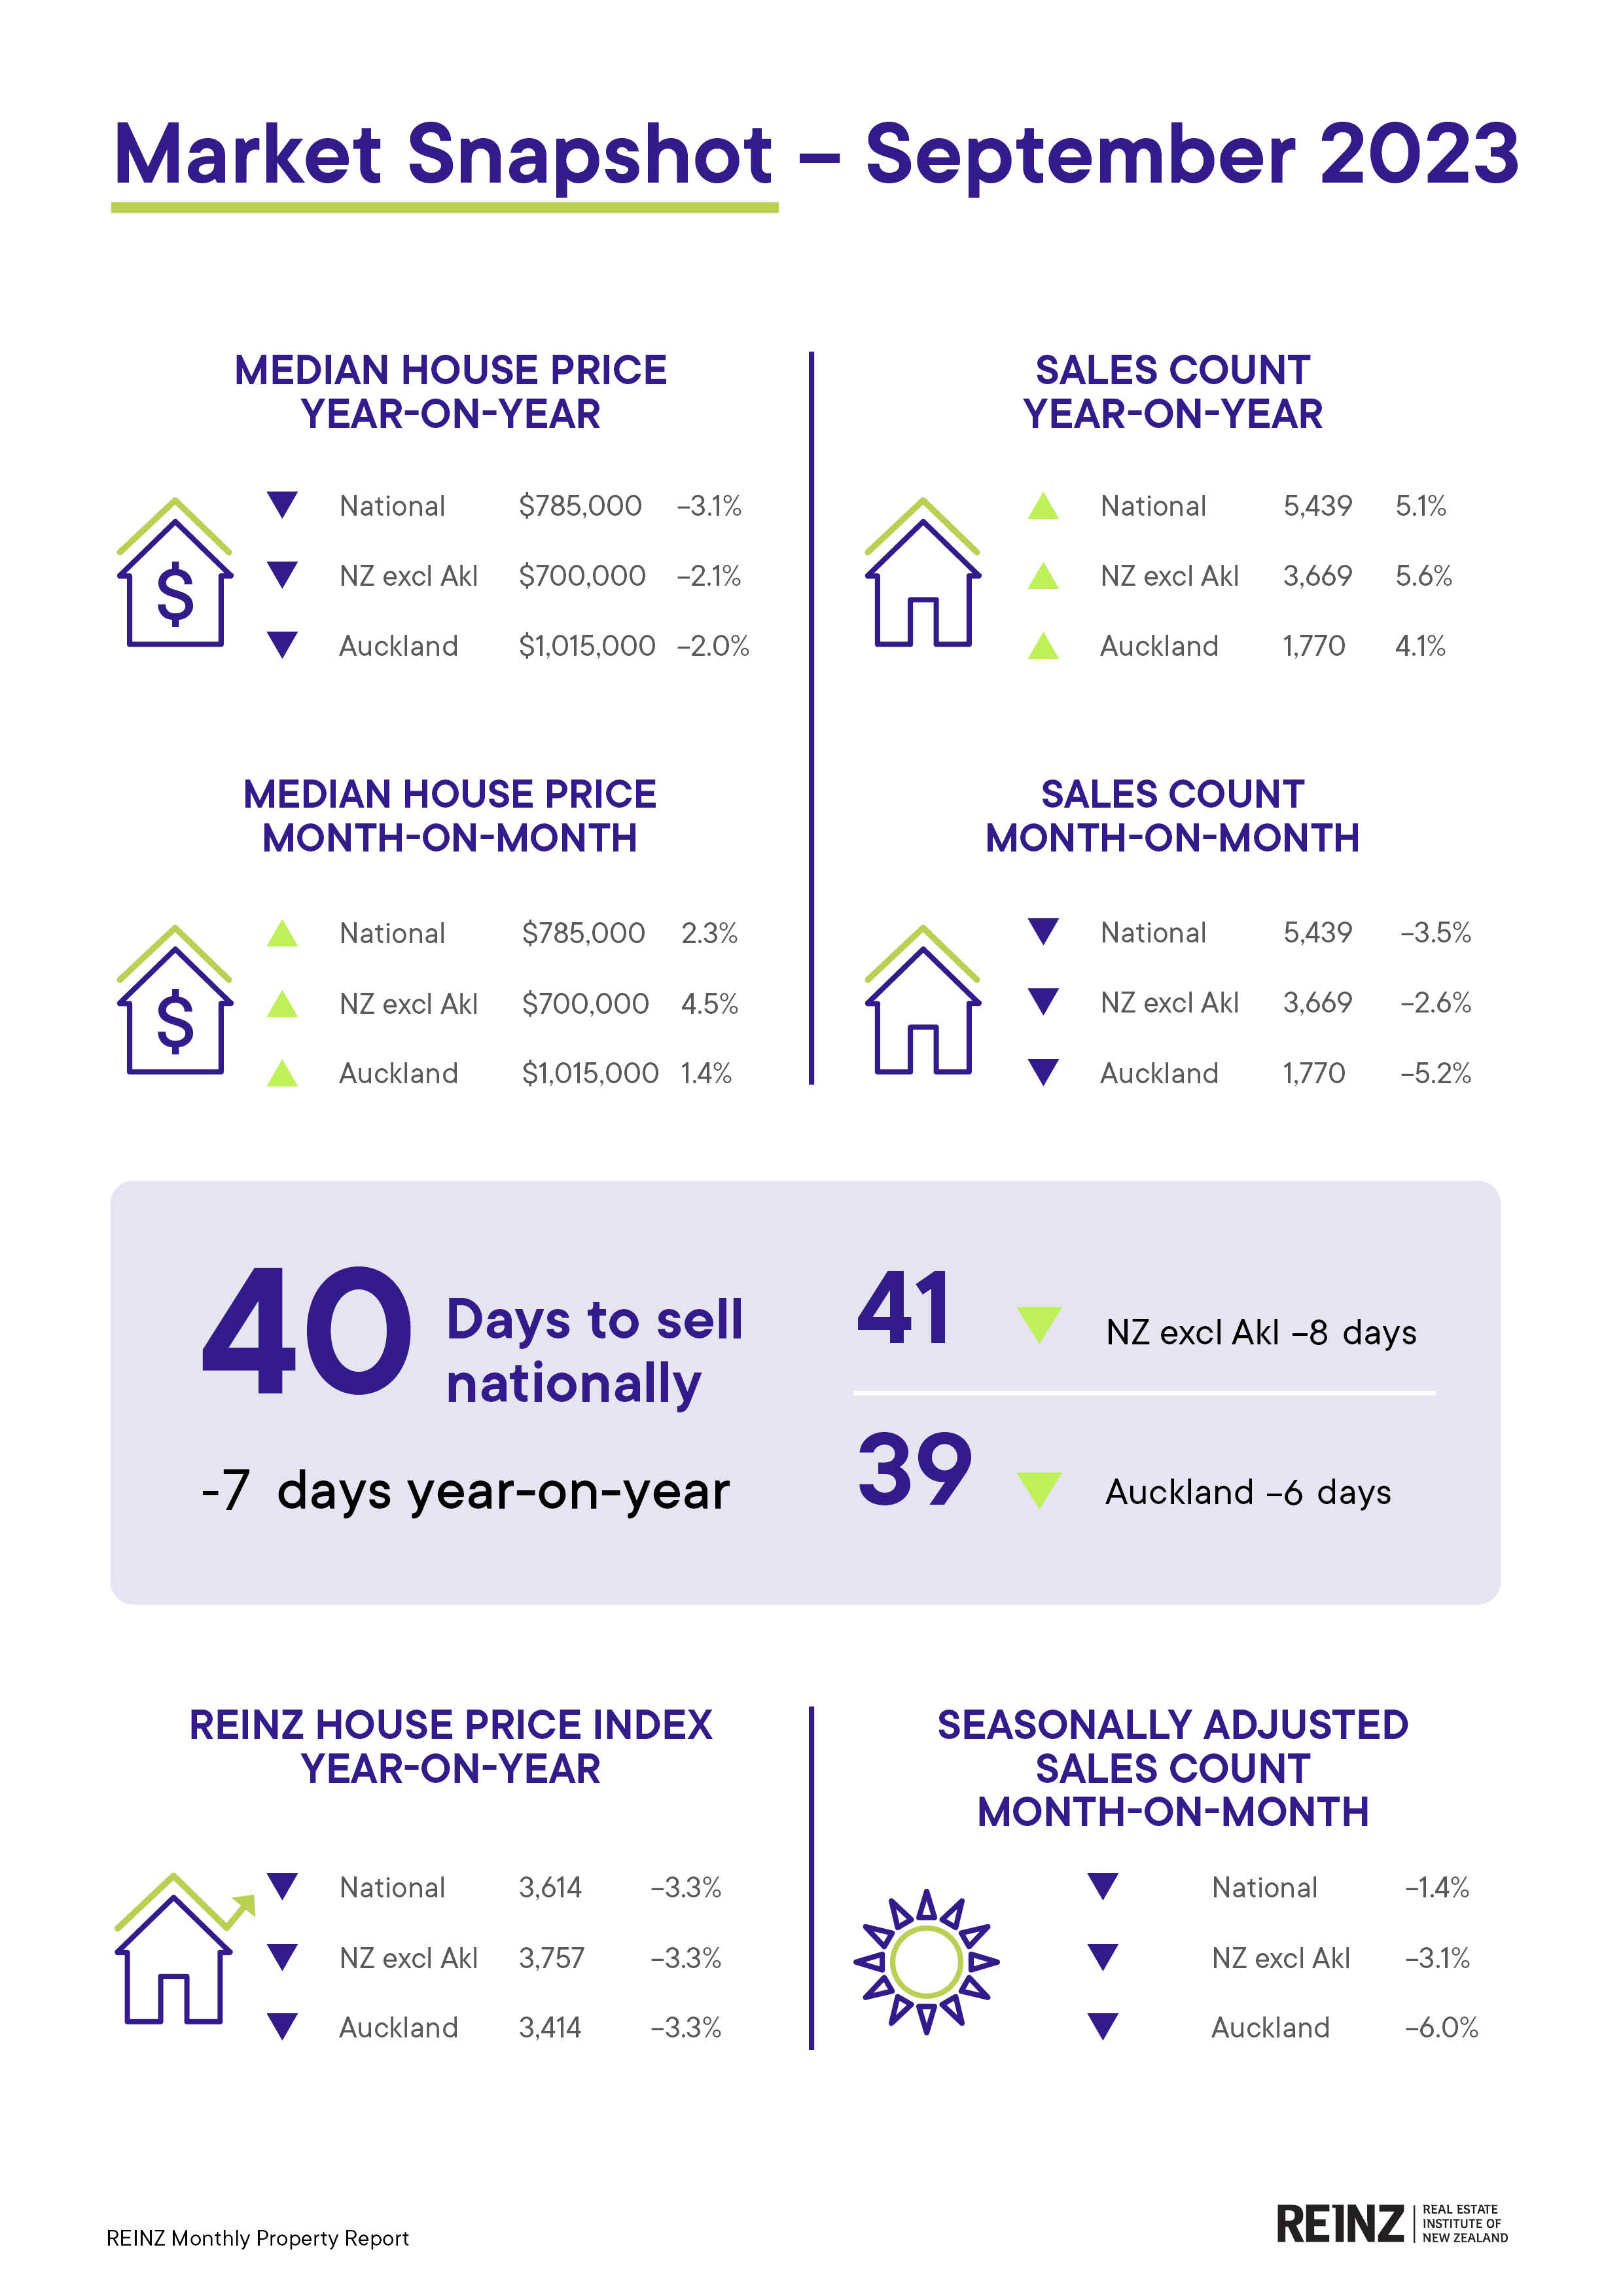
Sales counts across New Zealand were 5.1% higher in September compared to this time last year from 5,174 to 5,439, year-on-year, and up 5.6% for New Zealand excluding Auckland, increasing from 3,474 to 3,669 year-on-year.
Marlborough had the highest increase in sales count, up by 66.7% year-on-year. Other regions with increases were Northland (1.8%), Auckland (4.1%), Bay of Plenty (2.8%), Hawke’s Bay (3.0%), Manawatu/Whanganui (22.6%) Taranaki (16.2%), Tasman (16.4%), Canterbury (13.9%) and Southland (10.7%).
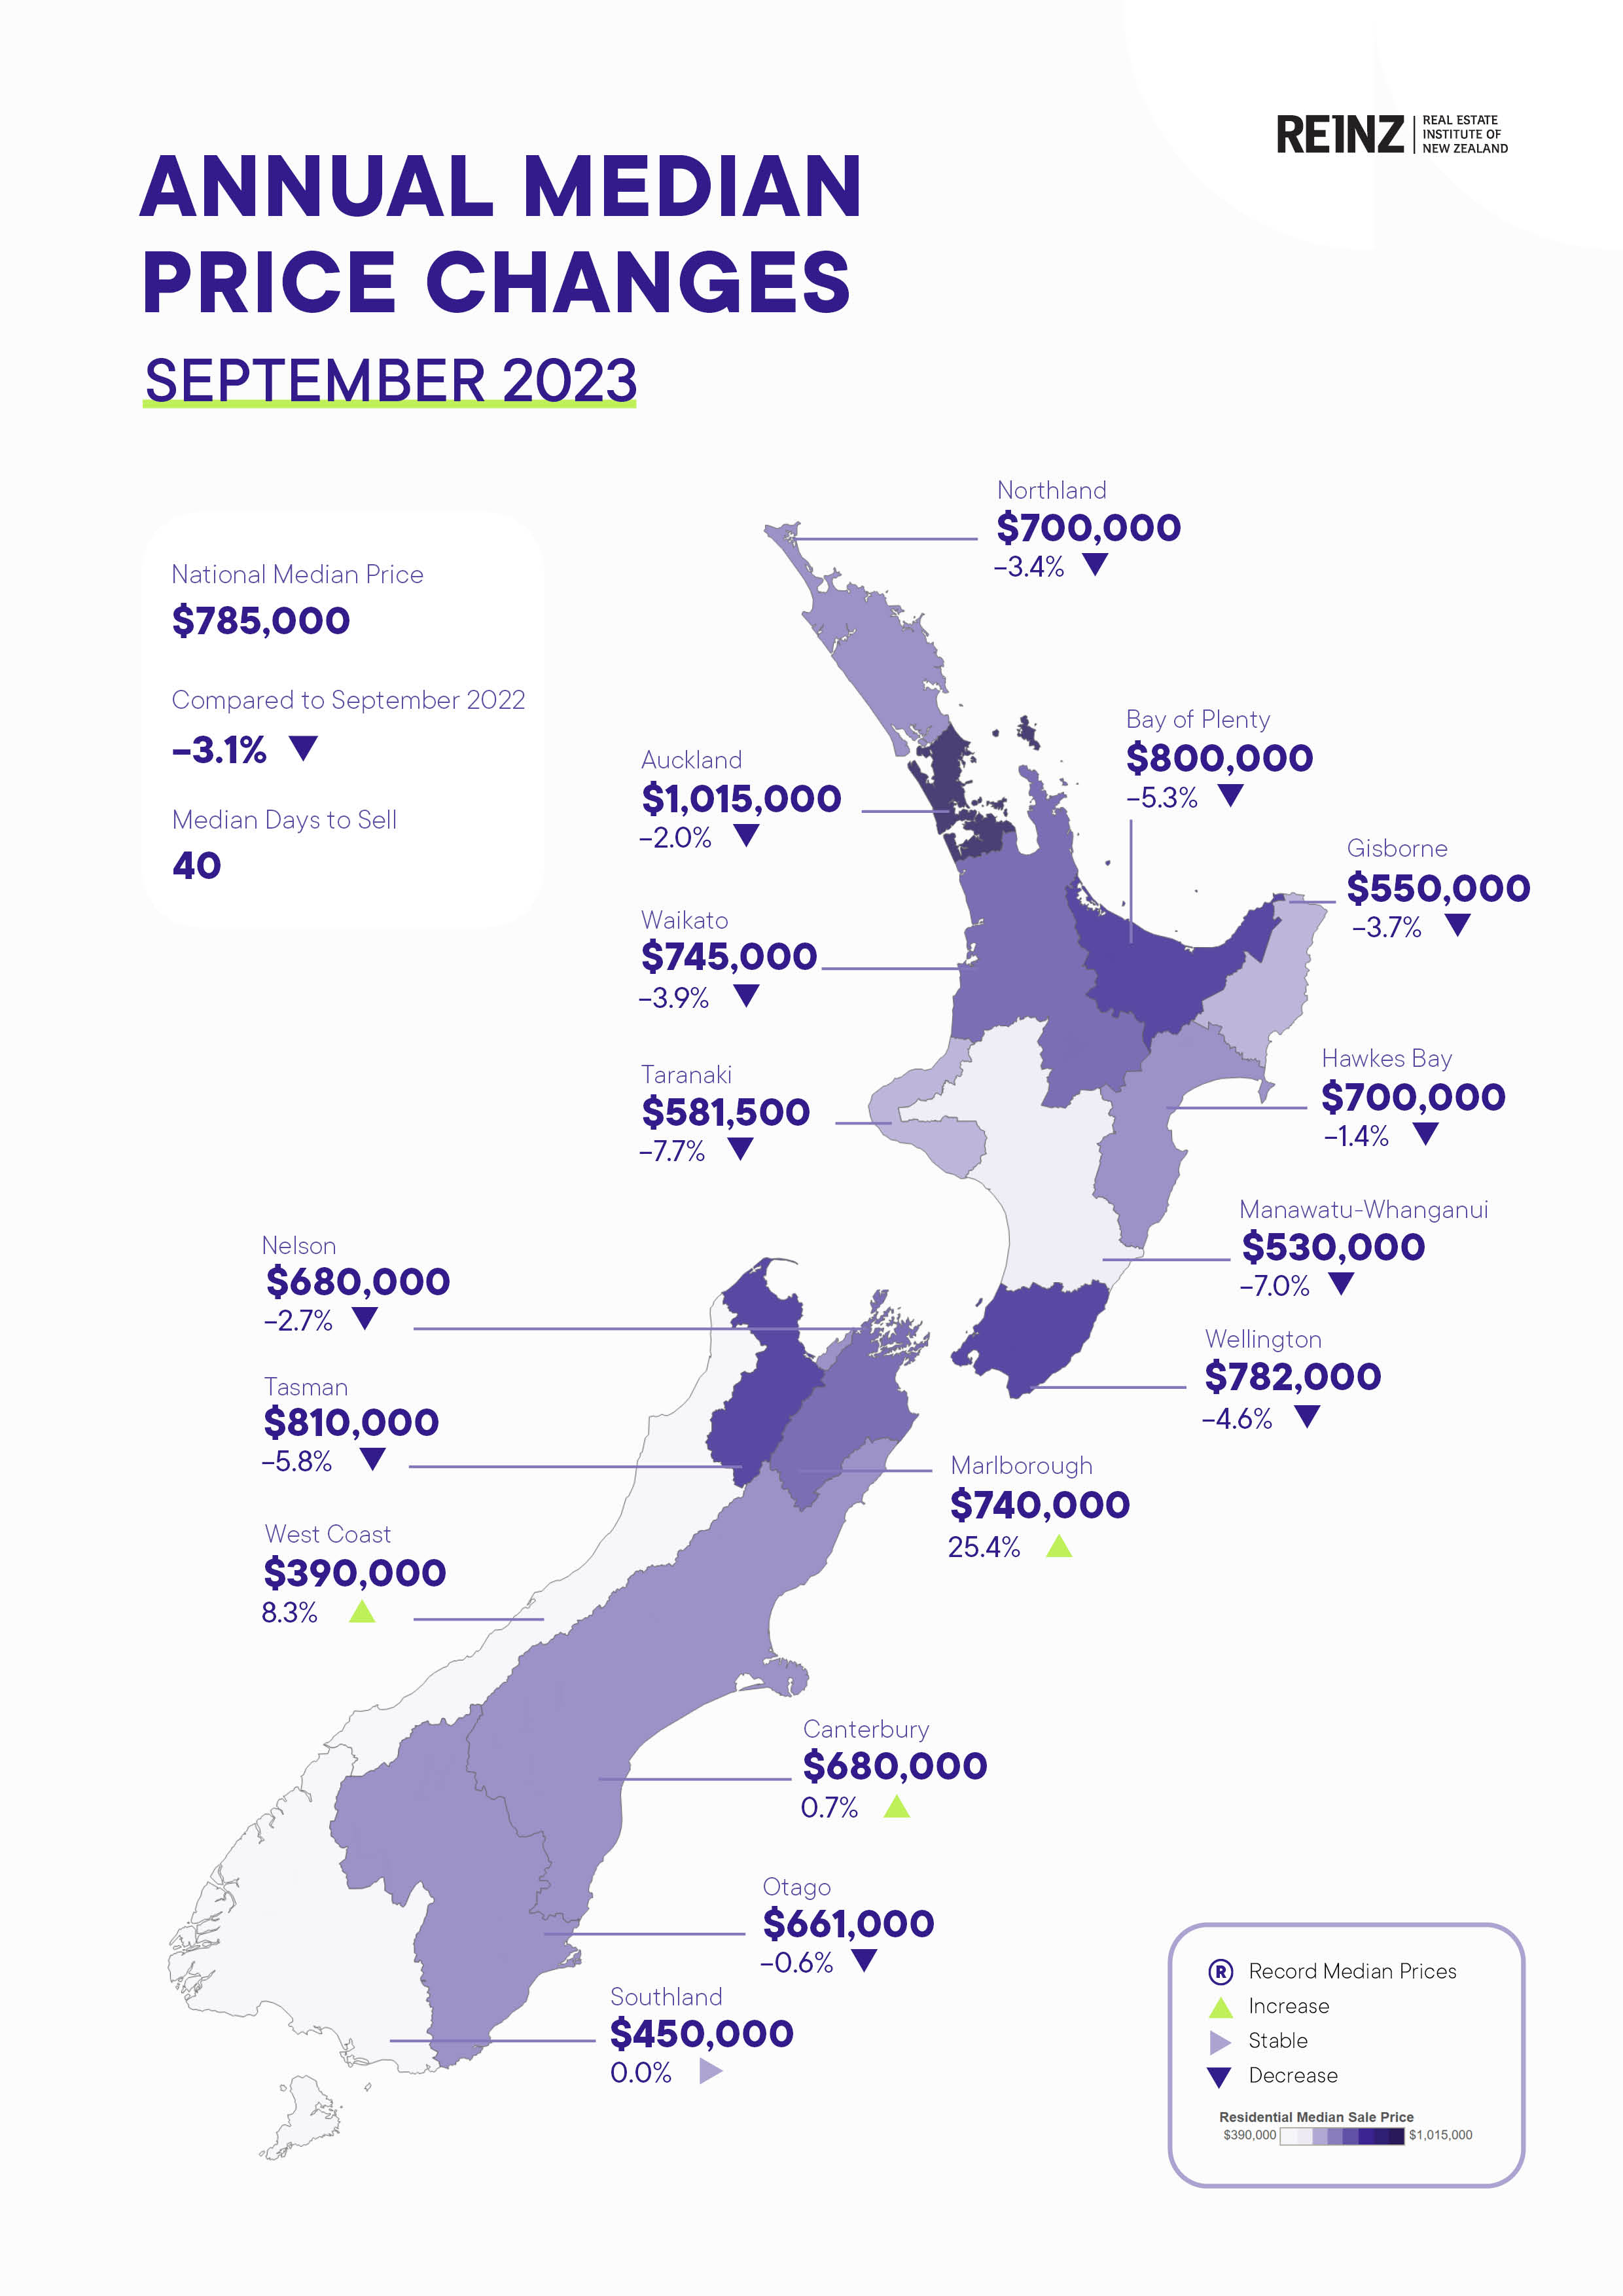
Nationally there was a 2.3% increase in the median sale price rising to $785,000 from $767,500 month-on-month but decreasing year-on-year by 3.1%. Median sale prices have increased in all but three regions month-on-month, with the West Coast (+16.4%), Marlborough (+13.8%) and Otago (+9.3%) leading the way.
At the end of September, the total number of properties for sale across New Zealand was 23,564, down 9.0% (2,339 properties) from 25,903 year-on-year. However, the number rose by 3.6% month-on-month as we would expect heading into the busier months of the annual property market cycle. New Zealand excluding Auckland inventory was down year-on-year from 15,744 to 14,690, a decrease of 1,054 properties or 6.7%, but increased by 4.2% month-on-month.
The national median days to sell reduced by 7 days year-on-year from 47 to 40 days, and 3 days month-on-month from 43 to 40 days. For a third month (49 July, 43 August and 40 in September), available inventory is now moving quicker. Ten regions saw a decrease in the median days to sell compared to September 2022, with the biggest decrease occurring in Wellington, which dropped 22 days from 56 days to 34 days.
The numbers we are seeing this month show the expected upturn in the market post winter but after many months of a much weaker market, there seem to be stronger signals in growing activity from both buyers and sellers.
Nationally, new listings decreased by 0.9% from 7,881 listings to 7,812 year-on-year and increased 4.9% month-on-month compared to August 2023. For New Zealand excluding Auckland, listings decreased 4.7% year-on-year from 5,201 to 4,954 and increased 8.9% month-on-month.
This month only four regions had a negative month-on-month shift in listings. Listings and the median days to sell are key areas to watch as they can indicate a shift in the property market cycle. Local agents continue to report an increase in activity, enquiry, and bigger numbers at open homes.
We can also see auctions coming back with some positive numbers this month. Nationally auctions comprised 15.3% of the total sales for September 2023, compared to 14.0% in August 2023 and 11.4% compared to September 2022.
The public want to know what is happening now, should they sell, should they buy, or what are prices doing. The election is two days away, we’re past the traditionally quiet winter months, and the market is turning. Certainty is returning for some who are seeing the low point of the market cycle behind them and are acting.
Post the election there will be an adjustment and with another OCR announcement coming at the end of November, there will be some who do still hold off, but we are seeing more people, both buyers and sellers, decide now is the time for them to be in the market. Agents are also reporting that the pipeline for new listings is looking healthy.
The HPI for New Zealand stood at 3,614 in September 2023, showing a 0.7% increase compared to the previous month. However, when compared to the same period last year, the HPI reflects a 3.3% decline. The average annual growth in the New Zealand HPI over the past five years has been 5.7% per annum and it currently sits 15.5% below the peak.
Fact sheet
National highlights for September 2023
- The nationwide median price was down 3.1% year-on-year to $785,000. For New Zealand excluding Auckland, the median price decreased by 2.1%, to $700,000.
- The total number of properties for sale across New Zealand was 23,564, down 9.0% (2,339 properties) from 25,903 year-on-year, and up 3.6% month-on-month.
- Sales counts across New Zealand were 5.1% higher in September compared to this time last year to 5,439, from 5,174 year-on-year.
- Nationally, new listings decreased by 0.9% from 7,881 listings to 7,812 year-on-year and increased 4.9% month on month compared to August 2023.
- The national median days to sell reduced by 7 days year-on-year and 3 days month-on-month.
- The REINZ House Price Index (HPI) for New Zealand showed an annual decrease of 3.3% in the value of residential property nationwide.
Regional highlights
- Marlborough had the highest increase in the number of sales, up by 66.7% annually.
- Median sale prices have increased in all but three regions month on month with the West Coast (+16.4%), Marlborough (+13.8%) and Otago (+9.3%) leading the way.
More information on activity by region can be found in the regional commentaries visit the REINZ website.
Median Prices
Three of sixteen regions had positive year-on-year median price movements, the largest being Marlborough with +25.4%. Thirteen regions had positive month-on-month movements, the West Coast leading the way with a 16.4% increase.
There were no record median prices at the regional level this month.
There was one record median price at the TA level this month – Otorohanga District with a median price of $620,000 which beat the prior record of $580,000 set in September 2021.
Hastings District has had four consecutive months of year-on-year increases, the most of all TA’s.
In terms of the month of September, this September saw the lowest sales count in:
- Otago since 2010
- Wellington since 2011
- Gisborne and Waikato since 2012
- Nelson since 2014
In terms of the month of September, this September saw the highest sales count in:
- Auckland, Marlborough, Northland and Tasman since 2020
Median Days to Sell
West Coast had its highest median days to sell since July 2022.
Gisborne had its lowest median days to sell since December 2020.
Wellington had its lowest median days to sell since December 2021.
Hawke’s Bay had its lowest median days to sell since March 2022.
Waikato had its lowest median days to sell since May 2022.
In terms of the month of September, September 2023 had the highest median days to sell in:
- Northland since 2008
- Otago since 2010
- Taranaki since 2011
- Bay of Plenty and Southland since 2014
House Price Index (HPI)
No regional HPI records this month.
Both Otago and Southland had year-on-year HPI increases this month. Southland is now only 1.7% below its peak HPI and Otago is 4.0% behind its peak.
Southland is the top-ranked HPI year-on-year movement this month. Otago is second and Canterbury is third.
In terms of the 3 months ending HPI movement, Otago ranks first, Wellington second and Southland third.
Inventory
Nine of fifteen regions have had a decrease in inventory in September 2023 compared to one year prior.
Both Gisborne and Wellington have had four months in a row where their inventory is 40% or more below the inventory of the year prior
Listings
Eleven of the fifteen regions had a year-on-year decrease in listings.
Marlborough has had three months in a row of year-on-year increases in listings whereas Auckland, Canterbury and Nelson have seen two months in a row of increased year-on-year listings.
Nationally, 15.3% (830) of properties were sold at auction in September 2023, compared to 11.5% (593) in September 2022.
New Zealand excluding Auckland saw 9.0% of properties (330) sell by auction compared to 9.1% (316) the year prior.


