In the coming months, all parts of the country are likely to feel some degree of property pain says Corelogic Senior Property Economist Kelvin Davidson

Clearly there is a tough period ahead for the economy, with GDP set to fall sharply amid rising unemployment.
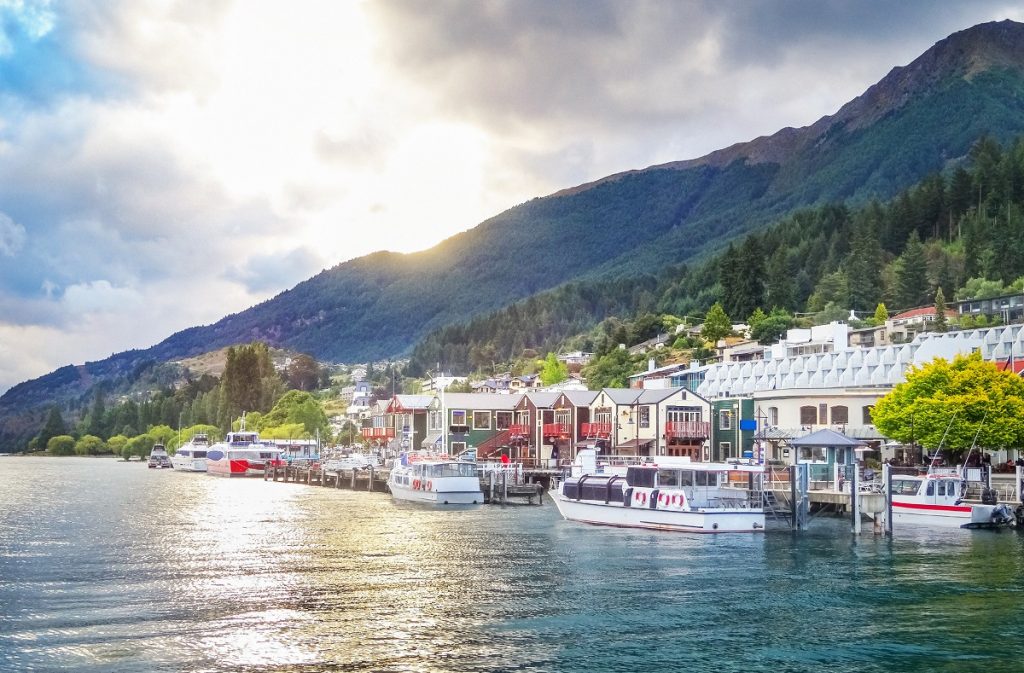
Based on a simple ranking across a range of indicators, Queenstown’s property market looks the shakiest. By contrast, Whangarei, Hamilton, and Invercargill appear to be a bit less risky.
Factors in favour of these ‘safer’ areas include less tourism reliance and not as big a surge in investor activity in their property markets of late.
Unfortunately for Queenstown, it has nearly 20 percent of its output coming from accommodation and food services and this is a sector set to be hit hard by the various stages of lockdown and the tourism downturn.
The Reserve Bank has estimated that accommodation and food services were only operating at 11 percent of pre-coronavirus norms during alert level four, rising to only 19 percent during level three.
For context, the government sector was estimated to be operating at 90 percent at both alert levels.
Elsewhere around the country, Tauranga or Wellington for example, accommodation and food services account for a much smaller share of the economy.
Wellington also has a high share of activity in relatively ‘safe’ sectors such as professional services, central government, and healthcare.
In other words, areas of the country with more diverse economies (and less concentration in tourism) should fare a little better.

Accommodation & food services sector % of economy in selected areas (Source: Infometrics)
We have also looked at areas where investors have recently had high shares of property purchases, as these could now be the markets most vulnerable to an investor reversal (perhaps as their tenants start to struggle and the rental returns suffer).
Napier has recently had a very high investor market share (relative to average), but Kapiti Coast and Hamilton have been lower, and hence are possibly more stable.

Difference in investors’ % share of purchases Q1 2020 vs. average (Source: CoreLogic)
Another potential fault line for property markets is the penetration of Airbnb – a previously high presence for holiday lets could now see a big switch of property into the traditional long-term rental sector (suppressing rents) and/or more owners of these properties deciding to sell.
On this measure, Queenstown again stands out as a ‘risky’ area, with around 20 percent of its dwelling stock listed on Airbnb. Rotorua and Nelson also have relatively large Airbnb markets, although proportionally still far smaller than Queenstown.

Airbnb listings as % of total dwellings (Sources: Airdna, CoreLogic)
Related to all of this is also the share of tourism in each area accounted for by domestic versus international visitors. With the border likely to be closed for many months to come (although potentially opened up to Australians at an earlier date), areas with a greater reliance on international visitors will tend to suffer the most, both in terms of their economic performance but also the impact on Airbnb demand and property investor confidence.
Unfortunately, Stats NZ has stopped collecting guest nights data, but while the figures were actually being collected, they highlighted once again the vulnerability of Queenstown – over the first nine months of last year, 70 percent of guest nights were from international visitors. By contrast, Palmerston North was just 12 percent.

International as % of total guest nights (Source: Statistics NZ)
So where does this leave us? To bring it all together, we’ve ranked a range of areas of the country across these four indicators (and applied a weighting system) – with the idea being to give an indicative guide to how vulnerable each area’s property market might be to a sales and/or price downturn. Areas to the left of the fifth chart are ‘riskier’, and those to the right are less vulnerable.

Weighted average ranking for economy/property ‘risk’ (higher=riskier) (Source: CoreLogic)
Perhaps not surprisingly, Queenstown doesn’t look good on this system, and that supports the popular perception amongst commentators that its property market could be in for some major problems.
Rotorua is another candidate often suggested as being vulnerable, but on our measure it does not look any worse than some other parts of the country (such as Christchurch, Auckland, and Dunedin), because it is not entirely dependent on tourism; other sectors such as healthcare and professional services also matter in Rotorua.
Elsewhere, most of the main centres (and a number of other main urban areas) look to be on a par in terms of their vulnerability to a property market downturn.
Invercargill, Hamilton, and Whangarei stand out as more resilient property markets on our basic weighting system.
It’s important to note that this is not an exact science – our weighting system is subjective and others may choose a different balance.
On top of that, a range of other factors matter too.
For example, some parts of the country (such as Dunedin) entered the lockdown with a tighter listings supply and more momentum in prices than others. This could be a factor in their favour post-lockdown and will also play a role in relative performance over the coming months and years.
Christchurch looks more affordable than has been the case for several years, potentially making it more resilient than our rankings imply.
Corelogic https://www.corelogic.co.nz/news-research/all-news/
Podcast https://corelogicnzpropertymarket.buzzsprout.com/


