
In a first for New Zealand, the average residential asking price has exceeded $1.6 million in one part of the country, but it is not the only area that has reached an all-time-high, realestate.co.nz’s Vanessa Williams says


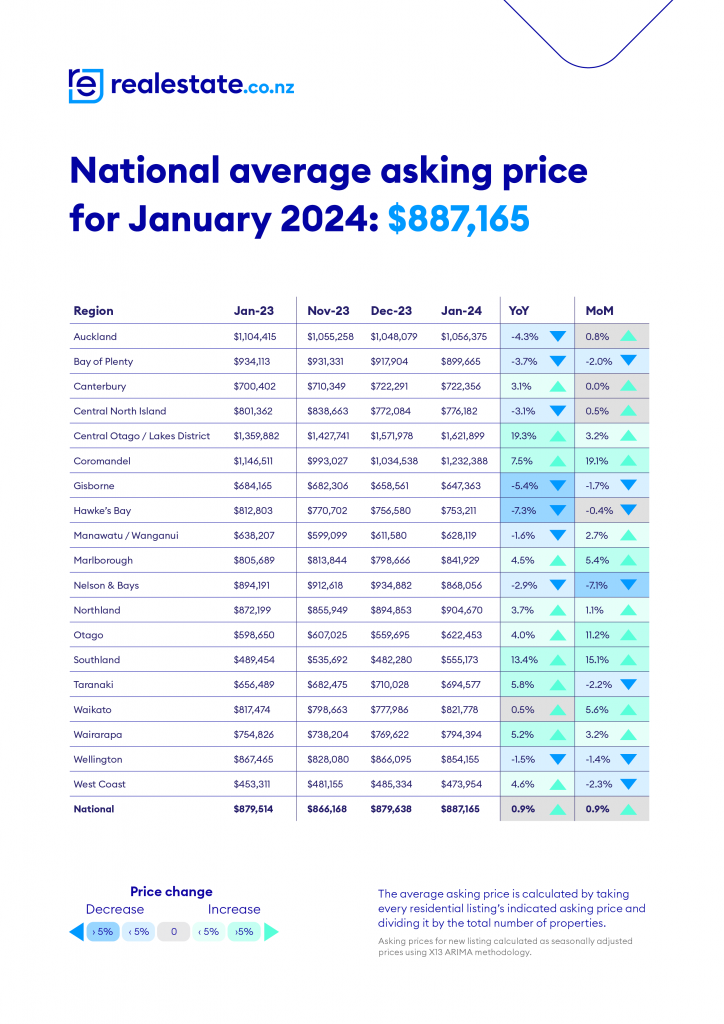
January data from realestate.co.nz saw Central Otago Lakes District’s average asking price soar past $1.6 million, setting a national record. Homes in this renowned Pinot Noir region are now averaging $1,621,899, marking a significant 19.3% increase from January 2023.
Central Otago Lakes District has been fetching the highest prices fairly consistently over the past five years, with brief stints from Auckland in June 2021 and January 2022.
Interest is also surging for Central Otago Lakes District. In January, property seekers on realestate.co.nz searching for properties in the area were up 39.6% compared to December and up 43.2% on January 2023. Interestingly, the most searched suburb was Cromwell, followed by Wanaka. Searches came from people in Auckland, Christchurch and Sydney, Australia. The activity highlights how important lifestyle factors are for property seekers.
Not long ago, in mid-2021, Auckland and Central Otago Lakes were at a similar price point of around 1.2 million. Since then, Auckland’s prices have dipped, while Central Otago Lakes’ have climbed.
Its neighbour, Southland, the second most affordable region in New Zealand, also achieved a 17-year record average asking price high. At $555,173, Southland’s average asking price is around a third of the price sought in Central Otago Lakes District.
The extraordinary rise in Central Otago Lakes District, crossing the $1.6 million mark, alongside Southland’s peak, highlights the diverse and dynamic nature of New Zealand’s property market.
Such contrasting price points within geographical proximity, offering buyers a wide spectrum of opportunities, highlights the uniqueness of each market and illustrates the broad appeal of New Zealand’s regions, catering to different lifestyles and buyer demographics.
The price gap between the regions illustrates the unique appeal of lifestyle areas like Central Otago Lakes and Coromandel over major urban centres like Auckland. The data tells us that when Kiwis look to buy property, lifestyle is a major consideration.
This is reflected in January’s data, with the average asking price upswings driven mainly by regional centres. Notably, Central Otago Lakes District, Coromandel, Marlborough, Northland, Otago, Southland, and Wairarapa all saw both year-on-year and month-on-month increases.
Prices in some locations have dipped year-on-year, though the decreases have been modest. None of the regions that experienced a drop saw declines greater than 10%, indicating stability in the market.
Sellers say signs up: new listings rise 10.5% nationally, signalling renewed market activity
After a year of low listing numbers, the new year has seen a change in seller activity, with a 10.5% increase in new listings nationally year-on-year. January 2024 also saw significant growth in new listings across 11 of 19 regions. Wairarapa (42.9%), Coromandel (26.4%), Auckland (22.4%), Marlborough (19.0%), Hawkes Bay (18.4%), Manawatu/Whanganui (17.8%), Northland (16.6%), and Central North Island (13.8%) all experienced a substantial year-on-year boost to new listings, surpassing the national average.
Conversely, Gisborne, West Coast, and Otago faced their lowest January listings since realestate.co.nz records began 17 years ago, with decreases of 20.5%, 27.1%, and 7.6%, respectively.
Looking month-on-month, the start of the new year brought a dramatic shift in market activity. Following a quiet December, realestate.co.nz data highlighted a 52.2% surge in new listings nationally, far exceeding the average 23.7% increase typically observed over the past five years between December and January.
This upswing in new listings nationally, along with heightened activity in regions like Wairarapa and Auckland, is a clear signal of renewed seller confidence and market vitality.
Back under the hammer: Auctions edge out display as preferred price type
In January, the way vendors chose to list their property for sale indicates market confidence.
Auctions are returning to their pre-December prominence after a hiatus over the festive break, rising 38.1% year-on-year to reclaim their status as the preferred pricing strategy for vendors.
Increased auctions reflect vendors’ preference for the transparency and competitive advantage that this sale method offers.
It’s a sign of sellers’ optimism and a belief in the strength of the current market, as they lean towards a method that can often bring about quicker sales.
Buyers are back: new year sees renewed demand for property
The start of the year saw a resurgence in demand for properties. Nationally, searches per listing were up by 21.0% on December and 14.2% compared to January last year.
This positive trend was mirrored in engagements (number of properties saved and email enquiries sent to agents), with a 25.3% increase from December and a 21.9% rise on the same period the previous year.
The significant increase in demand as we kick off the year is a clear sign that buyers have returned to the market with renewed interest.
Seeing such enthusiasm from buyers nationwide is encouraging, suggesting a strong start to the year and a positive outlook for the property market ahead.


