
The Real Estate Institute of New Zealand’s (REINZ) December 2023 figures show a notable increase in sales activity, median prices lifting, lower days to sell, and a clear sense of more confidence overall (year-on-year), Chief Executive Jen Baird says


December showed that the trend of steady improvement in property market activity has set in thanks to interest rates stabilising, the new Government announcing more details of its plans, and the arrival of the more active months in the property cycle.
The December figures showed a boost in activity in the market compared to a year earlier. We’ve been observing slow and steady improvement recently and we round out 2023 with continued improvement in sales activity in the market.
The number of properties sold increased by 14.1% (from 4,509 to 5,145) year-on-year across New Zealand, compared with December 2022. Month-on-month, sales for New Zealand decreased by 20.8% (from 6,493 in November 2023 to 5,145 in December 2023), in keeping with the quieter levels of activity that usually happen over the holidays.
For New Zealand excluding Auckland, the total number of properties sold reflected a similar pattern, increasing by 17.0% (from 3,135 to 3,667) year-on-year, and decreasing by 16.7% (from 4,401 to 3,667) month-on-month, as expected.
The data shows that almost every region recorded year-on-year increases in the number of properties sold in December. Tasman led the way with the strongest year on year increase in properties sold (+47.8%), followed by Gisborne (+35.7%) and Northland (+31.3%). Taranaki was the only region to see a decrease in the number of properties sold year-on-year (-8.0%).
Median sale prices were mixed for December, with fewer than half of the regions increasing month-on-month. Nelson and Taranaki stood out, with Nelson’s median price increasing by 10.5% ($650,000 to $718,500) and Taranaki increasing by 10.3% ($580,000 to $640,000) month-on-month. The other regions that increased month-on-month ranged from 1.8%-3.5% month-on-month.
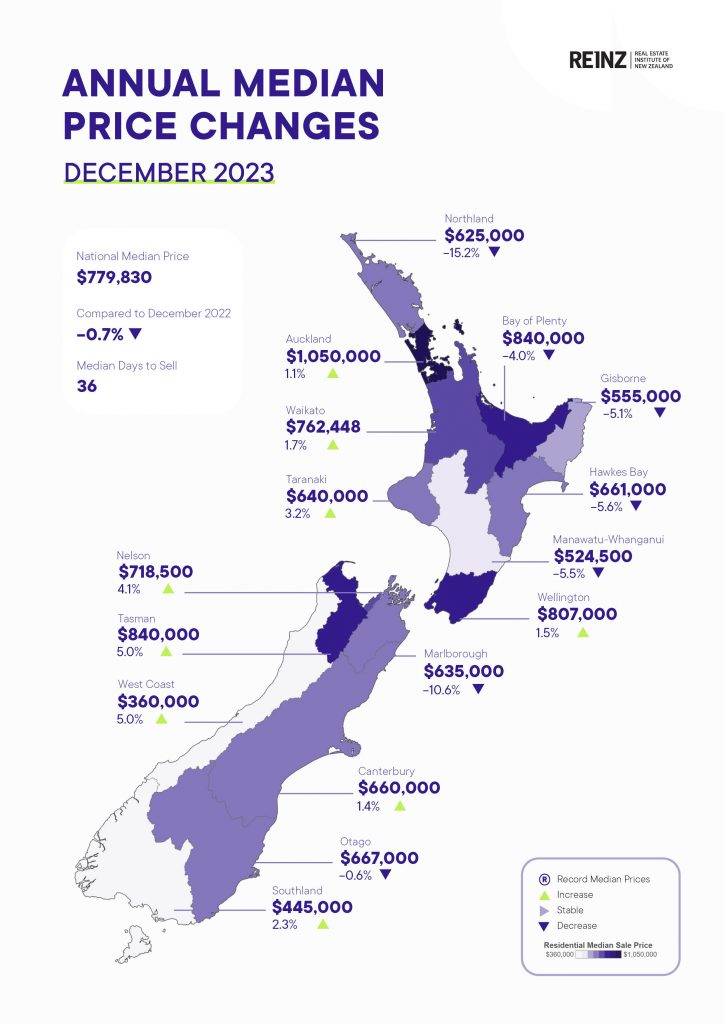
Year-on-year, median prices remained steady, with the national median sale price decreasing by 0.7% year-on-year to $779,830. There was no change (0.0%) in the median price for New Zealand excluding Auckland both year-on-year and month-on-month, with the price remaining at $700,000.
Nine of the 16 regions saw an increase in their median sale price year-on-year: Tasman and West Coast had the highest increase with 5.0% year-on-year, followed by Nelson (4.1%) and Taranaki (3.2%). This is a notable change compared with November, when only one region (Canterbury) recorded a year-on-year median price increase.
Many local agents are reporting signs of growing market confidence and activity levels now that the election is over and the new government has begun releasing details about its plans, and interest rates have stabilised.
While some buyers and sellers are waiting to see what the new year holds, it’s clear that there’s a growing understanding that the bottom of the market is behind us with annual median prices starting to lift in many regions – its clear more buyers and sellers feel that now’s the time to act.
December saw a significant increase in the number of properties sold compared to last year and open home attendance numbers were strong in many areas as well, although activity slowed down as it usually does heading into the holiday period.
In some areas, the holidays are an opportunity for out-of-towners to fall in love with a new town, with local agents in holiday hot spots like Taupo, Coromandel, Nelson and Tasman getting enquiries from visitors to the area.
The number of people choosing auction as a method of sale continues to grow, with 14.0% (718) of sales via auction in December 2023 compared with 11.4% (512) of sales via auction in December 2022.
The market is moving a little more quickly. The national median Days to Sell was 36 days, decreasing by two days compared to last month, and by four days year-on-year compared with December 2022.
Nationally, new listings decreased by 6.4% from 5,157 to 4,828 listings year-on-year. New Zealand excluding Auckland new listings decreased by 4.0% from 3,581 to 3,436 listings year-on-year.
The year-on-year decrease in listings is in contrast to the national year-on-year listings data for October and November, which saw increases in listings. The December listings figure is likely to reflect some vendors taking a ‘wait and see’ approach and holding off until the new year. However, local salespeople are getting strong levels of enquiry from potential sellers, so we expect to see listing numbers across New Zealand lift early in the next few months.
At the end of December, the total number of properties available for sale across New Zealand was 24,867, down 4.6% (1,190 properties) from 26,057 year-on-year, and down 11.2% (3,148 properties) from 28,014 month-on-month. For New Zealand excluding Auckland, inventory also decreased, down by 2.6% (418 properties) from 16,349 year-on-year, and down by 10.0% (1,761 properties) from 17,692 month-on-month.
While there is some regional variation, it’s clear that property ended the year on a positive note. As well as the lift in year-on-year measures such as sales and drop in Days to Sell, the Housing Price Index is 0.5% higher compared with a year ago, and that provides a clear signal that the market is moving into more positive territory.
In aggregate, 2023 was a slightly busier year in real estate, compared to 2022. Across the year we saw a total of 63,361 sales made, up 0.6% from 2022, 91,231 properties were listed for sale, down 12.1% on 2022.
Looking ahead, although interest rates and other economic factors continue to influence the market, many buyers and sellers are increasingly positive. There are higher levels of enquiry from potential buyers and sellers across the country, which will boost market activity further through summer.
These factors, combined with the drop in the number of listings, are expected to boost demand, along with the potential return of investors to the market as the government moves to change regulation impacting that sector. All up, we anticipate that activity will continue to pick up as the new year gets underway.
The HPI for New Zealand stood at 3,647 in December 2023, showing a 1.1% decrease compared to the previous month. However, when compared to the same period last year, the HPI reflects a 0.5% increase. The average annual growth in the New Zealand HPI over the past five years has been 5.9% per annum. It remains 14.7% below the peak of the market reached in 2021.
National highlights for December 2023
- The national median price has decreased by 1.9% to $779,830 month-on-month and decreased slightly (-0.7%) year-on-year from $785,300. For New Zealand excluding Auckland, the median sale price did not change (0.0%) both year-on-year and month-on-month, with the price remaining at $700,000.
- At the end of December, the total number of properties available for sale across New Zealand was 24,867, down 4.6% (1,190 properties) from 26,057 year-on-year, and down 11.2% month-on-month.
- The number of properties sold across New Zealand increased by 14.1% (from 4,509 to 5,145) year-on-year, compared with December 2022, and decreased by 20.8% month-on-month.
- Nationally, new listings decreased by 6.4% from 5,157 to 4,828 listings year-on-year, and decreased month-on-month by 54.9%.
- The national median Days to Sell decreased by two days month-on-month to 36 days, and decreased by four days year-on-year.
- The REINZ House Price Index (HPI) for New Zealand showed an annual decrease of 0.5% in the value of residential property nationwide.
Regional highlights
- Tasman and West Coast both recorded the highest year-on-year increase in median sale price, of 5.0%.
- Tasman had the highest increase in sales counts, up by 47.8% annually. Other regions with notable increases were Northland (31.3%), Waikato (24.1%), Bay of Plenty (24.1%), Gisborne (35.7%), Hawke’s Bay (27.7%), and Marlborough (29.1%).
- Nelson had the biggest decrease in median Days to Sell month-to-month, reducing by 6 days compared to November 2023.
Median Prices
- Nine of the 16 regions had a year-on-year increase in their median sale price. This is the highest number of regions with a year-on-year increase since August 2022, and a notable change compared with November, when only one region (Canterbury) recorded a year-on-year median price increase. Compared to December 2022:
o Auckland’s median price increased by 1.1%
o Waikato’s median price increased by 1.7%
o Taranaki’s median price increased by 3.2%
o Wellington’s median price increased by 1.5%
o Tasman’ median price increased by 5.0%
o Nelson’ median price increased by 4.1%
o West Coast’s median price increased by 5.0%
o Canterbury’s median price increased by 1.4%
o Southland’s median price increased by 2.3%. - Manawatu-Whanganui has recorded 19 consecutive months of year-on-year median price decreases for the first time since records began.
- Bay of Plenty has recorded 16 consecutive months of year-on-year median price decreases for the first time since records began.
- Bay of Plenty has recorded 16 consecutive months of year-on-year median price decreases for the first time since records began.
- There were no record median prices at the regional level this month.
- There were no record median prices at the TA level this month.
Sales counts
- December 2023 saw the highest sales count in
o Gisborne since October 2022 - December 2023 saw the lowest sales count in
o Taranaki and West Coast since January 2023
o Auckland since April 2023 - In terms of the month of December, December 2023 saw the lowest sales count in
o Taranaki since 2000 - In terms of the month of December, December 2023 saw the highest sales count in
o Tasman since 2019
Median Days to Sell
- Manawatu-Whanganui, Wellington and Otago had their lowest median Days to Sell since December 2021
- Auckland had its lowest median Days to Sell since January 2022
- NZ, NZ Excl. Auckland, and Waikato had their lowest median Days to Sell since March 2022
- In terms of the month of December, December 2023 had the highest median Days to Sell in
o Marlborough since 2001
House Price Index (HPI)
- No regional HPI records this month.
- Five regions had year-on-year HPI increases this month with Otago now only sitting 2.1% below its peak achieved in December 2021. Otago is the top-ranked HPI year-on-year movement this month. Wellington is second and Canterbury is third.
- In terms of the 3 months ending HPI movement, Nelson/Marlborough/Tasman/West Coast ranks first, Wellington second and Otago third.
Inventory
- Nine of 15 regions have had a decrease in inventory in December 2023 compared to one year prior.
- Northland has had 21 consecutive months where their inventory has been at least 15% higher than the same month the year before.
- Conversely, Gisborne and Wellington have had 9 consecutive months where their inventory has been at least 20% lower than the same month the year before.
Listings
- Auckland had the lowest number of listings this month since records began in January 2007
- Six of the 15 regions had a year-on-year increase in listings.
- Marlborough has had 6 months in a row of year-on-year increases in Listings
Auctions
- Nationally, 14.0% (718) of properties were sold at auction in December 2023, compared to 11.4% (512) in December 2022 and 20.4% (1,325) compared to November 2023.
- New Zealand excluding Auckland saw 9.1% of properties (333) sell by auction compared to 12.4% (547) the month prior.
- Auckland Region saw 26.0% of properties (385) sell by auction compared to 37.2% (778) the month prior.


