
More competitive prices and a ‘get in now’ attitude is bringing more buyers out ahead of this year’s election, but a potential change in Government and ongoing tighter economic conditions are seeing sellers holding back, REINZ Chief Executive Jen Baird says


The Real Estate Institute of New Zealand’s (REINZ) July 2023 figures show more activity emerging while listing numbers remain low seeing total stock numbers fall and some regions have seen little movement in median prices.
July tends to be a slower month for the property market, however we are seeing buyers returning alongside varying results across Aotearoa.
This month’s figures show a lift in market activity with sales counts slightly increasing in many parts of the country on July last year, and the year-on-year decrease in median prices continuing to ease, suggesting some confidence is returning.
Compared to July 2022, July 2023 has shown a slight increase in the total number of properties sold across New Zealand, up 1.6% to 4,903, but down 15.6% month-on-month. New Zealand excluding Auckland sales counts decreased by 2.5% year-on-year from 3,343 to 3,258.
Across the regions, Auckland (10.8%), Waikato (9.4%), Bay of Plenty (13.7%), Nelson (3.9%), West Coast (31.0%) and Canterbury (10.1%) all saw increases in sales counts year-on-year. Bay of Plenty was also up 7.8% month-on-month.
At the end of July, the total number of properties for sale across New Zealand was 23,090, down 12.4% (3,268 properties) from 26,358 year-on-year, and down 6.4% month-on-month. New Zealand excluding Auckland was down year-on-year from 15,732 to 14,497, a decrease of 1,235 properties or 7.8% annually.
With sales counts up this month, the national inventory level is falling. More competitive prices and a ‘get in now’ attitude is bringing more buyers out ahead of this year’s election.
Nationally, new listings decreased by 17.6% year-on-year, from 7,470 listings in July 2022 to 6,156 in July 2023, and a 1.0% decrease compared to June 2023 from 6,218. New Zealand excluding Auckland listings decreased 19.5% year-on-year from 4,778 to 3,847.
These listing decreases are similar to last month’s so although our salespeople are reporting further increases in activity across the country the looming election and ongoing tighter economic conditions are seeing sellers holding back.
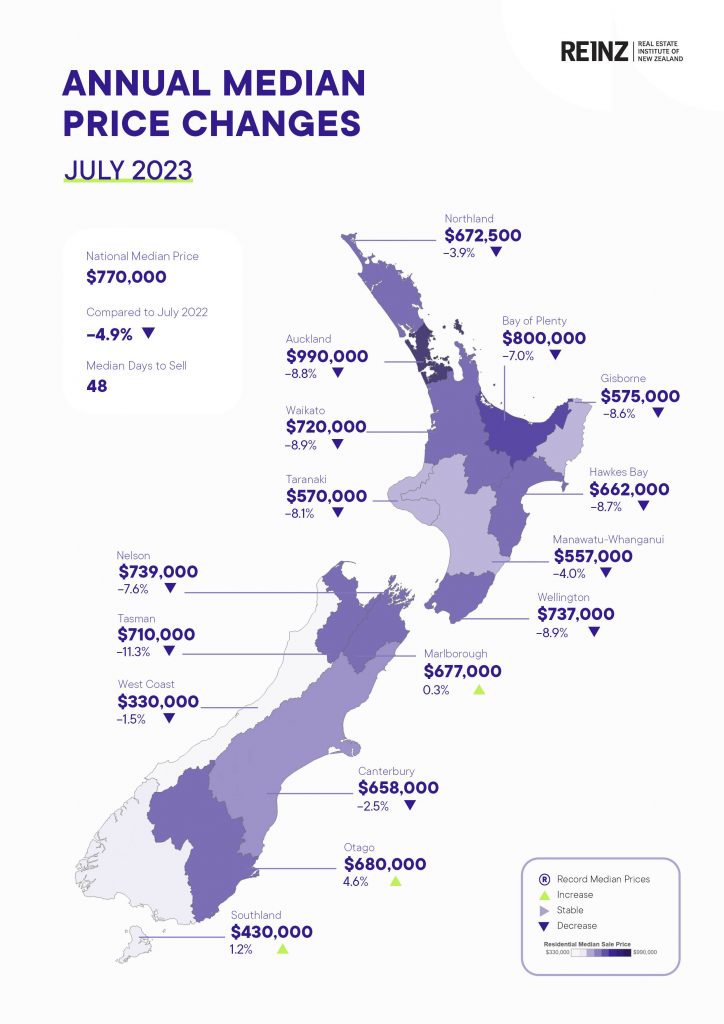
Nationally, the July 2023 median sale price decreased 4.9% year-on-year to $770,000 from $810,000. There was significant regional variation in this month’s median sale prices. Auckland, the country’s largest property market, saw its median sale price fall 8.8% from July 2022 to fall back under the one million dollar mark and decrease 1.0% compared to June 2023, down from $1,000,000 to $990,000.
Other regions such as Waikato (down 8.9% year-on-year), Bay of Plenty (down 7.0% year-on-year), and Wellington (down 8.9% year-on-year) also saw declines. Three regions have seen a year-on-year price increase – Marlborough (0.3%) and both Southland (1.2%) and Central Otago (4.6%) have seen more resilient markets for much of this year.
The national median days to sell remained relatively stable at 48 days. The median days to sell varied across regions. West Coast had the shortest median days to sell at 28, while Tasman had the longest at 80.
The ongoing impact of government policies, economic conditions, and global factors will continue to shape the New Zealand housing market. We also tend to see a slowing in activity in the lead-up to a general election, but with buyer activity rising and lower levels of supply coming to market, we may see stronger demand appear in the coming months.
While there was a slight increase in the House Price Index (HPI) compared to the previous month, the market continues to face challenges with a decline in value over the past year.
The HPI for New Zealand stood at 3,551 in July 2023, showing a 0.7% increase compared to the previous month. However, when compared to the same period last year, the HPI reflects a 6.9% decline.
National highlights
- The national median price has decreased 1.3% month-on-month and decreased 4.9% year-on-year from $810,000 to $770,000. For New Zealand excluding Auckland, median prices decreased 5.4% from $719,000 to $680,000 year-on-year but remained stable at $680,000 with a $400 difference month-on-month.
- The total number of properties for sale across New Zealand decreased 12.4% year-on-year, and down 6.4% month-on-month.
- The total number of properties sold across New Zealand in July 2023 increased 1.6% year-on-year to 4,903, decreasing 15.6% month-on-month.
- Nationally, new listings decreased by 17.6%, from 7,470 listings in July 2022 to 6,156 listings in July 2023.
- Days to sell have remained at 48 days for July 2023 — no change from June 2023 and up 1 day from July 2022.
- The REINZ House Price Index (HPI) for New Zealand showed an annual decrease of 6.9% in the value of residential property nationwide.
Regional highlights
- Marlborough (0.3%), Otago (4.6%) and Southland (1.2%) saw an increase in median sale price with Otago increasing 4.6% both month-on-month and year-on-year from $650,000 to $680,000 in both instances.
- Nelson had the biggest month-on-month increase with a 13.7% rise in median sale price from $650,000 to $739,000.
- Bay of Plenty had both a yearly and monthly increase in sales count with a 7.8% increase month on month (347 to 374) and a 13.7% increase year on year (329 to 374).
- The West Coast again had the highest sales count with a 31% increase year on year from 29 to 38 properties sold.
Median Prices
There were no record median prices at the regional level this month.
One Territorial Authority, Central Otago District recorded a record median price this month of $680,000.
Three-quarters (75%) of all Territorial Authorities have had no median record price in any of the past 12 months.
Sales counts
Compared to July 2022:
- Auckland was up 10.8% year-on-year
- Waikato was up 9.4% year-on-year
- Bay of Plenty was up 13.7% year-on-year
- Nelson was up 3.9% year-on-year
- West Coast is still performing up 31.0% year-on-year
- Canterbury was up 10.1% year-on-year
For the three months ending July 2023, New Zealand sales count was up 6.8% year-on-year.
In terms of the month of July, this July saw the lowest sales count in:
- Manawatu-Whanganui, Otago, Southland, and Wellington since records began.
- Tasman since 2008
- Marlborough since 2010
- NZ Excl. Auckland and Gisborne since 2011
- Northland since 2012
- Hawke’s Bay and Taranaki since 2014
Days to Sell
Tasman had its highest median days to sell since January 2005 when it was the same as this month. July 2001 was the last time there was a high median days to sell in Tasman.
Manawatu-Whanganui had its highest median days to sell since February 2015
Marlborough had its lowest median days to sell since May 2022
In terms of the month of July, July 2023 had the highest median days to sell in:
- Nelson since 2000
- Tasman since 2001
- NZ since 2008
- Otago since 2009
- NZ Excl. Auckland since 2011
- Taranaki since 2012
- Manawatu-Whanganui and Northland since 2014
- Southland since 2015
In terms of the month of July, July 2023 had the lowest median days to sell in
- West Coast since 1994
House Price Index (HPI)
No regional HPI records this month.
Otago has spent the past 7 months in the top 3 ranked regions for HPI year-on-year increases and is the top-ranked HPI year-on-year movement this month. Canterbury is second and Southland is third.
In terms of the 3 months ending HPI movement, this month saw the first increases in New Zealand, Auckland, Manawatu-Whanganui, and Wellington since December 2021 and the first increase in Canterbury since March 2022.
Inventory
Five of fifteen regions had at least a 14% year-on-year increase in inventory.
Four of fifteen regions had at least 18% less inventory than they had one year ago.
Listings
All regions had a decrease in listings since July 2023 except for Marlborough, a notable exception with a 12.5% increase in listings.
Six of fifteen regions have had listings decrease by more than 20% year-on-year.
Inventory and listing data come from realestate.co.nz.
Auctions
Nationally, 8.2% (517) of properties were sold at auction in July 2023, compared to 4.9% (461) in July 2022. Month-on-month there were 34 less auctions than June 2023.
New Zealand excluding Auckland saw 7.4% of properties (197) sell by auction, compared to 7.2% (217) the year prior.


