
While REINZ’s October figures saw an increase in enquiry and open home attendance in some regions, rising interest rates have caused hesitancy


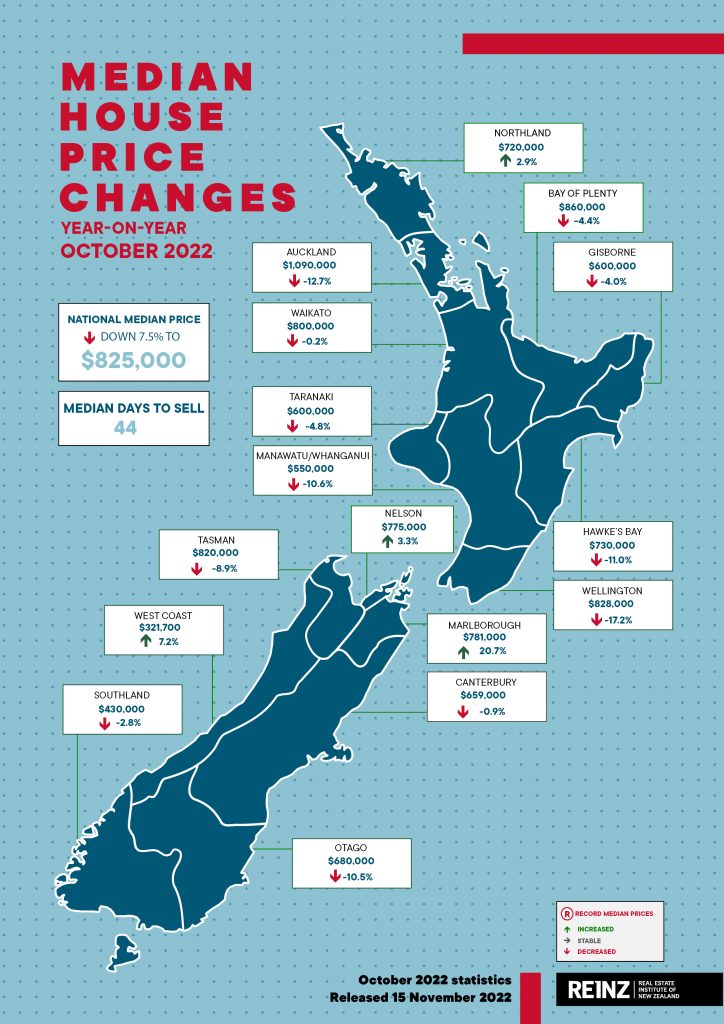
- The median price for residential property in Aotearoa New Zealand decreased 7.5% annually, from $892,000 to $825,000 in October 2022.
- There was a monthly uptick of 1.9% in the national median price (September 2022: $810,000).
- New Zealand excluding Auckland recorded a 3.4% decrease in annual median price movement.
- There was one record median price: Marlborough saw a 20.7% annual increase, up to $781,000.
- Sales activity is down 34.7% — from 7,486 to 4,892.
- Annual comparisons reflect a month when lockdown Alert Level 3 restrictions were eased (6 October) in Auckland, which saw a significant uptick in transactional volume.
- Nationally, the housing market value — measured by the REINZ House Price Index — dropped 10.9% annually and is down 12.4% from its peak in November 2021.
- Rising interest rates and changes to tax legislation and property regulation are affecting the market — salespeople report hesitancy amongst buyers and concern amongst vendors that the value of their property will decline.
- Properties are staying on the market longer; the national median days to sell was 44 in October, an annual increase of 10 days — but down from 47 in September.
- Stock levels were up 74.7% compared to October 2021; listings were down 4.0% compared to the same period last year.
- With all regions seeing more property for sale, buyers have greater choice.
While October sees an increase in enquiry and open home attendance in some regions, rising interest rates have caused hesitancy amongst buyers across Aotearoa New Zealand. The national median price showed improvement on September. Still, prices continue to ease, sales activity remains down and properties are taking longer to sell than in October 2021, according to the latest data and insights from the Real Estate Institute of New Zealand (REINZ), home of the most complete, accurate and up-to-date real estate data in New Zealand.
Across New Zealand, median prices for residential property (excluding sections) decreased 7.5% annually, from $892,000 in October 2021 to $825,000 in October 2022. Month-on-month, this represents a 1.9% increase from $810,000 in September.
The median residential property price for New Zealand excluding Auckland, decreased 3.4% — from $750,500 to $725,000. There was a month-on-month increase of 1.5% from $714,000 in September.
Four regions had an annual increase in median price in October 2022, and the Marlborough region reached a record median price — up 20.7% to $781,000.
Auckland’s median price decreased 12.7% compared to October last year, from $1,249,000 to $1,090,000. The region has recorded six consecutive months of annual median price decreases for the first time since August 2008 to January 2009. All seven Auckland districts had negative annual median price movements; North Shore saw a decrease of 18.2%, followed by Papakura, down 17.3%.
In Wellington, the median price was down 17.2% annually, from $1,000,000 to $828,000 in October 2022. Wellington has recorded five consecutive months of year-on-year median price decreases — the first time since May to September 2011. All eight Territorial Authorities (TAs) had negative annual median price movements, with South Wairarapa seeing the greatest decrease, down 33.7%, followed by Carterton, down 26.5%.
Two TAs achieved record median prices; The Marlborough District reached a median price record of $781,000, and Invercargill City reached a record $485,000. More information on activity by region and TA record median prices can be found in the regional commentaries section of the Monthly Property Report.
“In October 2021, increased optimism over the easing of lockdown restrictions in Auckland combined with a delay to the introduction of changes to the Credit Contracts and Consumer Finance Act (CCCFA) from October to December impacted market activity,” REINZ Chief Excutive Jen Baird says.
“Able to transact and keen to move before tougher lending restrictions were implemented, people come to market hard and fast, contributing to a sense of urgency that is reflected in REINZ property data for October last year and is apparent in our annual comparisons.
“In October 2022, the national median price decreased 7.5% compared to the same period last year. Four regions bucked the trend — with Marlborough reaching a record median price. It is worth noting while the region’s location and size mean it can be less affected by some market headwinds, the median price is more subject to variability than bigger regions due to the smaller volume of transactions. For example, in September, the region recorded its lowest median price since August 2021; this month, it hit a record high. Time will tell if this high is the new normal or an anomaly due to a relatively small number of sales.
“This year, several compounding factors have created uncertainty and hesitancy in the market where there was confidence and urgency last year — rising interest rates and the cost of living, tax legislation and property regulation, tightened lending criteria, and global events with macro-economic impacts.
“We see downward pressure on prices, and the pace of the market has come down. However, over the last couple of months, salespeople have observed an increase in enquiries and a noticeable increase in the number of first home buyers back in the market,” Baird observes.
Sales activity down year-on-year, some regions see monthly uptick
The number of residential property sales across New Zealand decreased annually by 34.7%, from 7,486 in October 2021 to 4,892 in October 2022. Month-on-month, there was a decrease of 4.3%.
The sales count for New Zealand excluding Auckland decreased by 30.4% annually, from 4,798 to 3,338. Sales activity fell 2.4% compared to September 2022.
The regions with the greatest annual percentage decrease were:
- Tasman, which decreased 45.0% annually from 80 to 44
- Auckland, which decreased 42.2% annually from 2,688 to 1,554
- Southland, which decreased 40.9% annually from 149 to 88
- Northland, which decreased 39.1% annually from 184 to 112.
“In September, the data showed the usual spring uplift was subdued – the story remains similar through October. Nationally, sales activity is down 34.7% year-on-year and 4.3% month-on-month.
“On an annual comparison, we’re comparing to a period of heightened activity. Month-on-month, looking at the actual numbers we see a 4.3% decrease in activity; however, adjusting for seasonality, we note sales are down 9.5% — October performed poorer than expected compared to September.
“Properties continue to change hands, and people continue to make life decisions. However, buyers and vendors are acting with caution, weighing up their options.
“There are signs of more buyers returning to the market. Owner occupiers — backed by equity — still dominate the market. But with an increase in property on the market, easing prices, and banks’ lending again, we see first home buyers dipping their toes in. While this is positive news, further increases in interest rates are putting a damper on buying plans in this buyer group, and we have yet to see their interest reflected in sales activity. Meanwhile, reports from salespeople across Aotearoa suggest investors continue to step back,” Baird observes.
“Annual inflation has hit 7.2%, and the Reserve Bank has increased the official cash rate to 3.5% and is expected to increase it to 4.0%, with some commentators suggesting 4.25%, by year’s end, with more increases to come in 2023. This means mortgage rates are yet to peak, and some banks are already increasing their fixed mortgage rates.”
Value of property nationally sees marginal monthly uptick
The REINZ House Price Index (HPI) for New Zealand, which measures the changing value of residential property nationwide, showed an annual decrease of 10.9% from 4,200 in October 2021 to 3,744 — down 12.4% from its peak in November 2021.
New Zealand saw a 0.2% increase in terms of HPI month-on-month movement.
For New Zealand excluding Auckland, the HPI decreased 8.4% annually — from 4,242 in October 2021 to 3,886 in October 2022.
Up 3.4% annually, Southland was the top-ranking region on the Index in October, followed by Northland (+1.6%). All other regions showed negative annual movement on the Index.
Wellington had the greatest decrease — down 19.7% compared to the same time last year — from 4,332 to 3,477. Wellington ranked bottom on the HPI annual movements for 11 consecutive months, and this month showed the greatest three-month drop in HPI movement, down 4.2%, followed by Manawatu/Whanganui, down 3.5%.
Auckland had the second greatest decrease in HPI movement, with an annual decrease on the index of 14.3% — from 4,144 to 3,550.
New Zealand’s median Days to Sell was 44 in October
Across New Zealand, the median number of days to sell (DTS) a property in October was 44 — up 10 days compared to October 2021. Month-on-month, properties were on the market three days fewer.
For New Zealand excluding Auckland, DTS increased 14 days to 44 — though down five days compared to September (49).
West Coast had the lowest DTS of all regions at 23, an annual decrease of 13 days. Manawatu/Whanganui had the highest median DTS at 54, followed closely by Bay of Plenty at 53.
New listings down, inventory up
Nationally, listings were down 4.0% annually to 9,289. New Zealand excluding Auckland saw an annual increase of 3.3%.
Overall, nine of the fifteen regions saw listings increase compared to October 2021, with four seeing increases of 20% or more. Northland had the greatest increase in listings, up 48.8%, followed by Waikato (36.5%), Nelson (31.0%) and Marlborough (20.0%).
Gisborne had the greatest annual decrease in listings — down 21.9%.
“Taking New Zealand as a whole, listings were down 4.0% compared to the same period last year. However, nine regions saw an increase of listings coming onto the market — spring tends to be a preferred time to sell as people look to make their moves ahead of the holidays.
“More listings, more options and more people preferring to take their time to make purchasing decisions means properties are staying on the market for longer. The median days to sell now sitting at 47 — up 10 days on October last year but selling faster than September,” Baird observes.
At the end of October, the total number of properties available for sale across New Zealand was 26,577 — an annual increase of 74.7%, from 15,217 in October 2021. For New Zealand excluding Auckland, it was 16,237 — an annual increase of 88.5%, from 8,614.
Southland and Gisborne were the only regions to see inventory levels increase annually by less than 50% — up 38.5% and 23.1%, respectively.
Five regions had over double the inventory they had last year, with Nelson and Waikato again experiencing the greatest annual increases in inventory levels — at 184.2% and 142.2%, respectively.
“Stock levels were up 74.7% compared to October 2021. All regions have more property for sale, putting downward pressure on prices.
“For owners looking to sell, this consideration will impact their decision-making. For those motivated to sell, working with a real estate professional who knows the local market will ensure you have the right strategy to achieve a sale you’re happy with,” Baird concludes.
Inventory and listing data come from realestate.co.nz.
Sales by auction
Nationally, 12.2% of properties (597) were sold at auction in October 2022, compared to 29.7% in 2021. New Zealand excluding Auckland saw 7.8% of properties (260) sell by auction, compared to 21.8% the year prior.
Auctions represented 38.9% of sales (14) in Gisborne, down from 49.2% in October 2021. In Auckland, 21.7% of sales were by auction (337) — compared to 43.9% at the same time last year.


