
As the total pool of properties available for sale falls to record lows, this is continuing to put pressure on house prices, with the country seeing a new record median house price for the fourth month in a row, REINZ reports

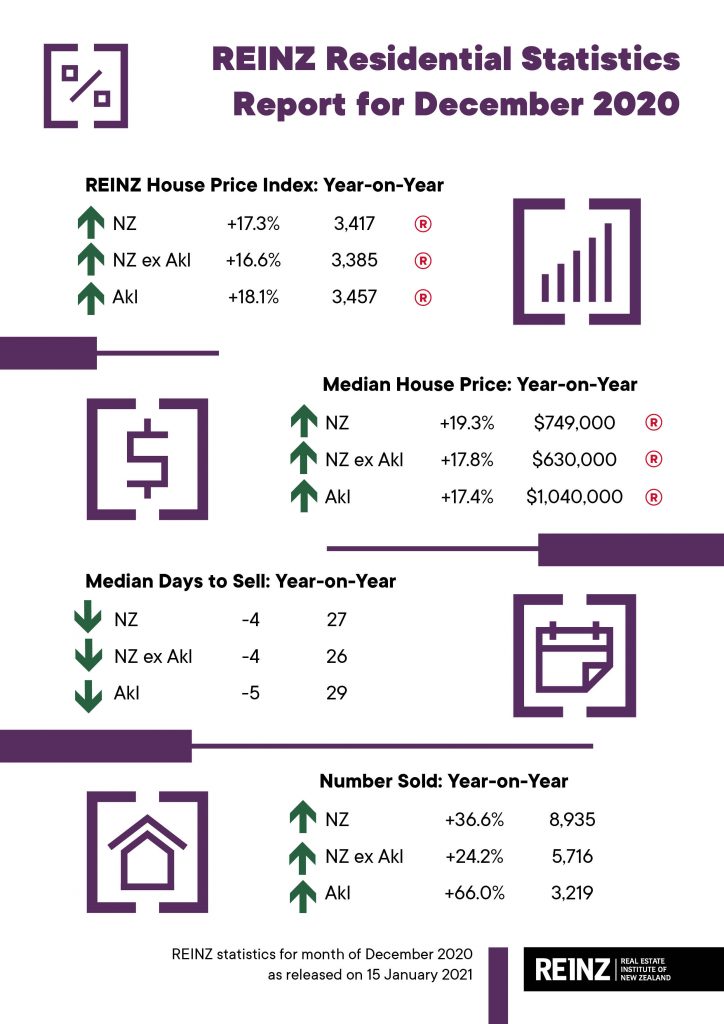
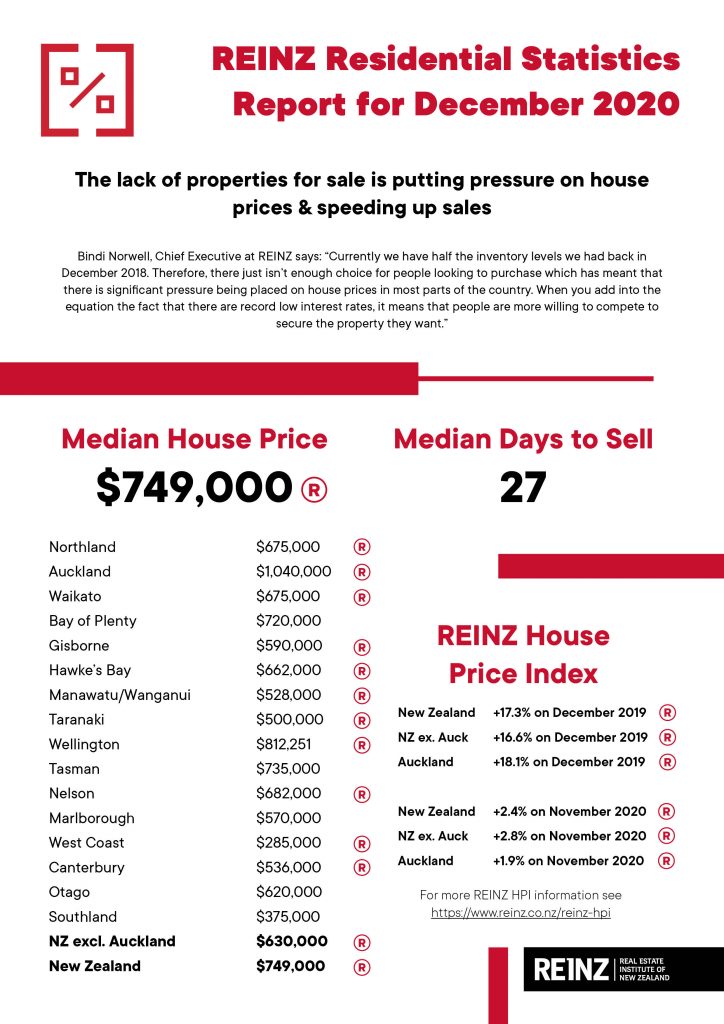
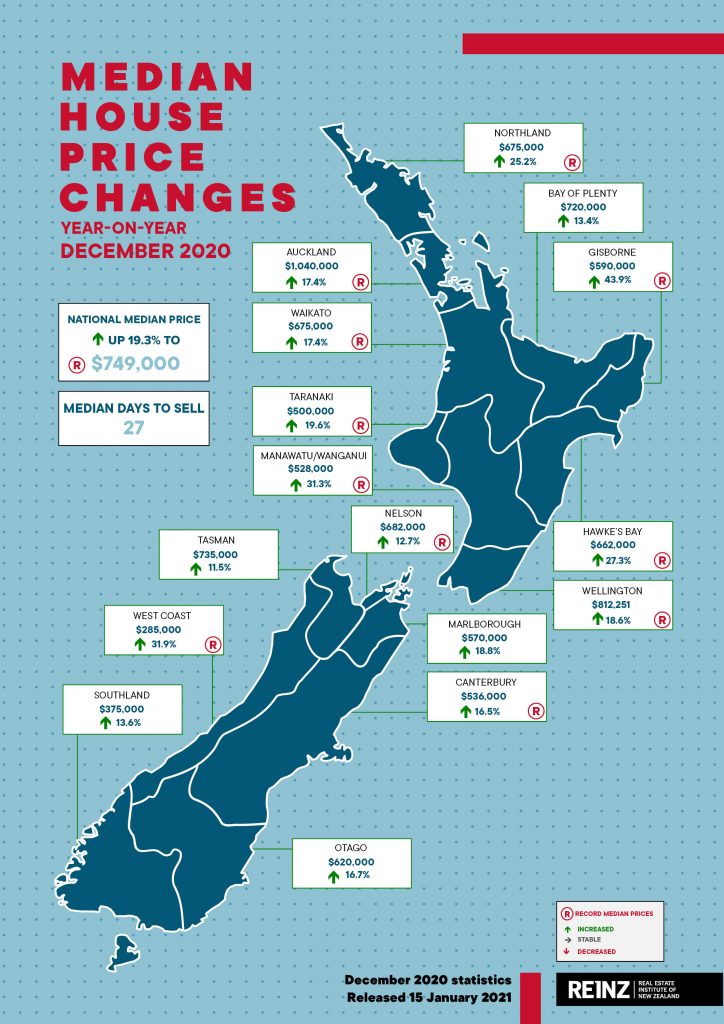
Median house prices across New Zealand increased by 19.3% from $628,000 in December 2019 to a new record median price of $749,000 in December 2020.
Median house prices for New Zealand excluding Auckland increased by 17.8% from $535,000 in December last year to a new record median price of $630,000.
Additionally, Auckland’s median house price increased by 17.4% from $886,000 at the same time last year to $1,040,000 a new record high – the fifth consecutive month where Auckland has seen a new record median house price.
In total 11 regions saw record median prices during December 2020. Regions in addition to Auckland with record median prices were:
- Gisborne with a 43.9% increase from $410,000 in December 2019 to $590,000 in December 2020
- West Coast with a 31.9% increase from $216,000 in December 2019 to $285,000 in December 2020
- Manawatu/Wanganui with a 31.3% increase from $402,000 in December 2019 to $528,000 in December 2020 – the sixth consecutive month of record median prices
- Hawke’s Bay with a 27.3% increase from $520,000 in December 2019 to $662,000 in December 2020
- Northland with a 25.2% increase from $539,000 in December 2019 to $675,000 December 2020
- Taranaki with a 19.6% increase from $418,000 in December 2019 to $500,000 in December 2020
- Wellington with an 18.6% increase from $685,000 in December 2019 to $812,251 in December 2020
- Waikato with a 17.4% increase from $575,000 in December 2019 to $675,000 December 2020 – the eighth month in a row of record high medians
- Canterbury with a 16.5% increase from $460,000 in December 2019 to $536,000 in December 2020 – the fifth consecutive month of record median prices
- Nelson with a 12.7% increase from $605,000 in December 2019 to $682,000 in December 2020.
“Currently we have half the inventory levels we had back in December 2018,” says Chief Executive at REINZ, Bindi Norwell.
“There just isn’t enough choice for people looking to purchase which has meant that there is significant pressure being placed on house prices in most parts of the country. When you add into the equation the fact that there are record low interest rates, it means that people are more willing to compete to secure the property they want.
“This lack of choice and high levels of confidence is also causing properties to be sold at the quickest pace we’ve seen in 17 years. The median number of days to sell a house is now just 27 days, showing how people are moving quickly to secure ‘good’ properties.
“Today’s figures further highlight that we urgently need a combined response from Government and industry to solve the housing affordability issues the country is facing.”
Highest number of properties sold in NZ in a December month, ever
The number of residential properties sold in December 2020 across New Zealand increased by 36.6% from December 2019 (from 6,543 to 8,935) – the highest number of properties sold in a December month ever.
For New Zealand excluding Auckland, the number of properties sold increased by 24.2% when compared to the same time last year (from 4,604 to 5,716).
In Auckland, the number of properties sold in December increased by 66.0% year-on-year (from 1,939 to 3,219) – the highest for the month of December since records began.
In addition to Auckland, regions with the largest increase in annual sales volumes during December were:
- West Coast: +55.3% (from 38 to 59 – 21 more houses) – the highest for the month of December in 14 years
- Canterbury: +45.6% (from 934 to 1,360 – 426 more houses) – the highest for the month of December since records began
- Waikato: +39.5% (from 641 to 894 – 253 more houses) – the highest for the month of December in 16 years
- Gisborne: +31.3% (from 48 to 63 – 15 more houses)
- Taranaki: +29.2% (from 144 to 186 – 42 more houses).
Regions with annual decreases in sales volumes were:
- Marlborough: -14.9% (from 87 to 74 – 13 fewer houses)
- Tasman: -14.3% (from 77 to 66 – 11 fewer houses)
- Nelson: -3.7% (from 82 to 79 – 3 fewer houses).
“Similar to what we’ve seen in the past few months, with market confidence high, buyers are likely to be keen to purchase ahead of further anticipated price rises and the re-introduction of the LVRs,” says Norwell.
“We expect that the housing market will be busy for the next few months. However, if we don’t see more stock come to the market, we may start to see this impact sales volumes going forward.”
REINZ HPI for Gisborne/Hawke’s Bay lifts by a quarter in December
The REINZ House Price Index (HPI) for New Zealand, which measures the changing value of property in the market, increased 17.3% year-on-year to 3,417 a new high on the index – the highest annual percentage increase in 63 months (September 2015).
Additionally, 11 out of 12 regions had double-digit annual growth figures – the first time in 15 years the index has been this strong.
The HPI for New Zealand excluding Auckland showed house price values increased 16.6% from December 2019 to 3,385 a new high for December 2020.
Auckland’s house price values increased 18.1% year-on-year to 3,457 also a new high for the index and the largest annual percentage increase we’ve seen for the region in 61 months (November 2015).
In December, Gisborne/Hawke’s Bay again had the highest annual growth rate in house price values with a 24.8% increase to a new record index level of 3,780. Again, in second place was Wellington with an annual growth rate of 20.5% to a new record index level of 3,509 and in third place was Manawatu/Wanganui with a 20.4% annual increase in house price values.
Median days to sell lowest in 204 months
In December, the median number of days to sell a property nationally decreased 4 days from 31 to 27 when compared to December 2019, the lowest in 204 months (since December 2003).
Across the country, 14 out of 16 regions had a median number of days to sell of less than 30 days which is the highest on record. Only Northland and the West Coast were exceptions.
For New Zealand excluding Auckland, the median days to sell decreased by 4 days from 30 to 26.
Auckland saw the median number of days to sell a property decrease by 5 days from 34 to 29, the lowest for the month of December in 17 years.
Taranaki had the lowest days to sell of all regions at 20 days – down 7 days from the same time last year. This was the lowest days to sell for Taranaki since records began. Additionally, Waikato (24), Bay of Plenty (27) and Manawatu/Wanganui (21) had record low median days to sell.
December saw 27.9% of all properties sold by auction, with 2,494 properties selling under the hammer – up from 13.6% at the same time last year, when 892 properties were sold via auction and up from 26.5% in November 2020. This was the highest percentage of auctions the country has seen in 63 months.
Inventory levels at lowest point ever
The total number of properties available for sale in New Zealand decreased by -29.1% in December to 12,932 – the lowest level of inventory ever. This was down from 18,230 in December 2019 – a decrease of 5,298 properties compared to 12 months ago. Additionally, every region – except Auckland and Gisborne – had their lowest levels of inventory ever.
Regions with the largest percentage decrease in total inventory levels were:
- Nelson: -49.1% from 352 to 179 – 173 fewer properties
- Marlborough: -49.0% from 245 to 125 – 120 fewer properties
- Manawatu/Wanganui: -48.3% from 609 to 315 – 294 fewer properties.
Wellington had the lowest number of weeks’ inventory with only four weeks’ inventory available to prospective purchasers. This is a record low level of inventory for any region since records began and highlights how we desperately need new listings to come onto the market in some parts of the country.
Northland and West Coast had the highest number of weeks’ inventory with 17 weeks’ inventory available to prospective purchasers down from 43 and 59 weeks respectively at the same time last year.
Price Bands
The number of homes sold for less than $500,000 across New Zealand fell from 32.1% of the market (2,099 properties) in December 2019 to 19.3% of the market (1,721 properties) in December 2020.
The number of properties sold in the $500,000 to $750,000 bracket fell from 33.0% (2,158 properties) to 30.8% (2,752 properties).
At the top end of the market, the percentage of properties sold for $1 million or more increased from 16.4% (1,071 properties) in December 2019 to 27.9% (2,493 properties) in December 2020.
Auckland now unaffordable for many
“Auckland City remains New Zealand’s most expensive district in the country,” says Norwell.
“December saw the City reach a new record median house price of $1,280,000 – hovering extremely close to the $1.3 million mark. Not far behind, was North Shore City on $1,235,000 and Rodney District on $1,005,000, showing how unaffordable the Auckland region is becoming – especially for first home buyers. The only district in Auckland now with a median under the $800,000 mark is Franklin District with a median of $790,000; while it might be the most ‘affordable’ area in Auckland, it does mean a significant commute to the city for those looking to purchase there.”
Many Aucklanders are now looking to the Waikato as an alternative, according to Century 21 New Zealand Owner, Derryn Mayne.
“Our offices in Waikato are seeing a lot of Aucklanders moving down. After the experience of lockdowns, many people realise they can work remotely and effectively from home, with more employers willing to enable it,” Mayne says.
The real estate boss says ongoing multi-billion-dollar State Highway One motorway extensions, and bypasses, are effectively bringing Waikato closer to Auckland. The Hamilton to Auckland passenger train service will also soon provide commuters with another option.
“Like many of New Zealand’s smaller towns that are in commuter proximity to much larger cities, the likes of Huntly and Te Awamutu are now seeing people moving out from Hamilton as well as down from Auckland.”
Huntly, with considerable SH1 traffic now diverted away from the township, is seeing plenty of action and opportunities too. One gamechanger being Sleepyhead’s ownership of 176-hectares of land, adjoining the nearby existing Ohinewai village. The site is proposed to be transformed into a mixed-use, fully master-planned community of up to 3,000 residents, creating considerable jobs and growth for North Waikato.
The Waikato District Council is tasked with managing growth within its area which is largely north and west of Hamilton. The district’s growth is expected to swell from 73,600 people to possibly 103,000 by 2045.
“Hamilton property was undervalued up until about five years ago, then it started climbing and hasn’t stopped. That has had a flow-on effect to neighbouring towns and lifestyle blocks as demand grows.
“While Waikato is by no means cheap anymore, the region continues to offer many Auckland families and retirees the chance to get ahead and enjoy a great lifestyle. With Auckland’s median price hitting seven figures, many are now actively eying the regions which will only continue,” says Mayne.
CoreLogic predicts record summer for property market
The CoreLogic House Price Index (HPI) for December shows nationwide property values continued to accelerate over the month, increasing by 2.6%. This takes growth in the final quarter of the year to 6.1% – a rate not bettered since the three months ending February 2004 (6.6%).
Index results as at December 31st 2020

In Tauranga the quarterly rate of growth exceeded ten percent (10.2%), which is an extraordinary figure and something last witnessed in May 2004 (10.5%), when the average property value was just over $350,000. That average value has now increased to $876,122 – up from less than $800,000 at the end of September 2020.
The quarterly rate of growth in Masterton is yet another step higher at 17.4%, while other provincial centres to exceed 10% quarterly growth include Whanganui (11.2%), Porirua (10.9%) and Gisborne (10.4%) with Palmerston North just shy at 9.6%.
Highlights over the 3 months to December 2020

Looking back to the start of the year, property values in Gisborne have increased by more than thirty percent (30.4%), which has seen the average property increase in value by almost $120,000 to smash the half million dollar mark at the end of December ($514,212).
The factors influencing such a rapid rate of capital gain include record low mortgage rates and tight inventory which has seen demand outweighing supply. Stronger than forecast economic conditions have buoyed consumer sentiment at a time of unprecedented global uncertainty. It is clear that New Zealanders are looking towards property as a safe investment and the most attractive asset for wealth accumulation.
Rolling change in property values, national

Furthermore, areas with a lower average value typically mean a greater number of eligible buyers and hence greater competition leading to stronger growth.
With consistent messages regarding the need to protect that wealth, coming from both the Government and the Reserve Bank of NZ (RBNZ), the risk factor of property investment has, on the face of it, reduced, which only encourages greater investment.
House Price Index – Main Centres Relative to December 2003

Without any major policy change regarding property in the works, the long term affordability of the property market is reliant on significantly increasing supply, which is a slow moving factor. So for now, all indications are that the fervent growth in property values will continue throughout the summer at least.


