
Property sales were up 191% from April to May but still down from last year by 46.6%, with prices fluctuating across the country, the Real Estate Institute of New Zealand (REINZ) has revealed
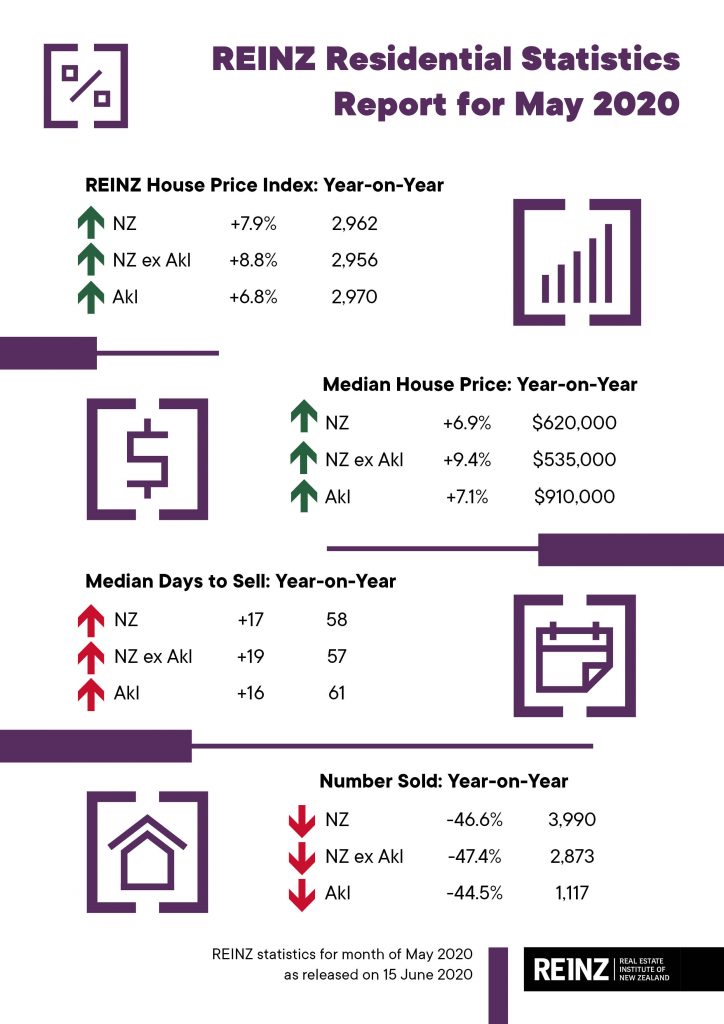
The number of properties sold in May across New Zealand decreased by 46.6% from the same time last year – from 7,477 to 3,990 – as Alert Level 3 restrictions on the real estate market still made it difficult for property sales to occur, according to the latest data from the Real Estate Institute of New Zealand (REINZ), source of the most complete and accurate real estate data in New Zealand.
Yet there was a strong uplift from sales activity from April to May, with the number of properties selling nearly trebling from during Alert Level 4 – from 1,371 to 3,990 – a 191.0% increase.
For New Zealand excluding Auckland, the number of properties sold decreased by -47.4% when compared to the same time last year (from 5,464 to 2,873).
In Auckland, the number of properties sold in May decreased by -44.5% year-on-year (from 2,013 to 1,117).
Again, there were no regions with annual increases in sales volumes during May. However, all regions had an uplift in sales volumes from April.
Regions with the largest decrease in annual sales volumes during May were:
- Tasman: -62.5% (from 80 to 30 – 50 fewer houses)
- Otago: -56.2% (from 479 to 210 – 269 fewer houses)
- Southland: -54.8% (from 210 to 95 – 115 fewer houses)
- Marlborough: -54.3% (from 105 to 48 – 57 fewer houses).
Bindi Norwell, Chief Executive at REINZ says: “The number of residential properties sold across New Zealand decreased by 46.6% in May when compared to the same time last year which is not surprising given we had the Alert Level 3 restrictions for the first 12 days of May. These restrictions meant only two property viewings, per property, per day were allowed, making it difficult to get interested parties through a property in a timely and efficient manner.
“With the Government initially wanting to restrict private viewings in Level 3, this would have had an even greater financial impact on people wanting to buy and sell property. So, we are pleased that some real estate activity was able to go ahead, thereby starting to get the market returning to a sense of normality more quickly,” continues Norwell.
“In a positive sign, there has been a good uplift in sales activity as we moved from April to May, with 15 out of 16 regions across the country seeing triple figure percentage increases in their month-on-month sales activity. The only exception was Auckland, but the city did still see a 98.8% increase when compared to April,” she continues.
“We’re still seeing a shortage of new listings come to the market which continues to impact sales volumes. Hopefully, as people’s confidence starts to lift as we move through the Alert Level systems the listings shortage will start to change.
Median prices mixed across country; still 3 regions with record median prices
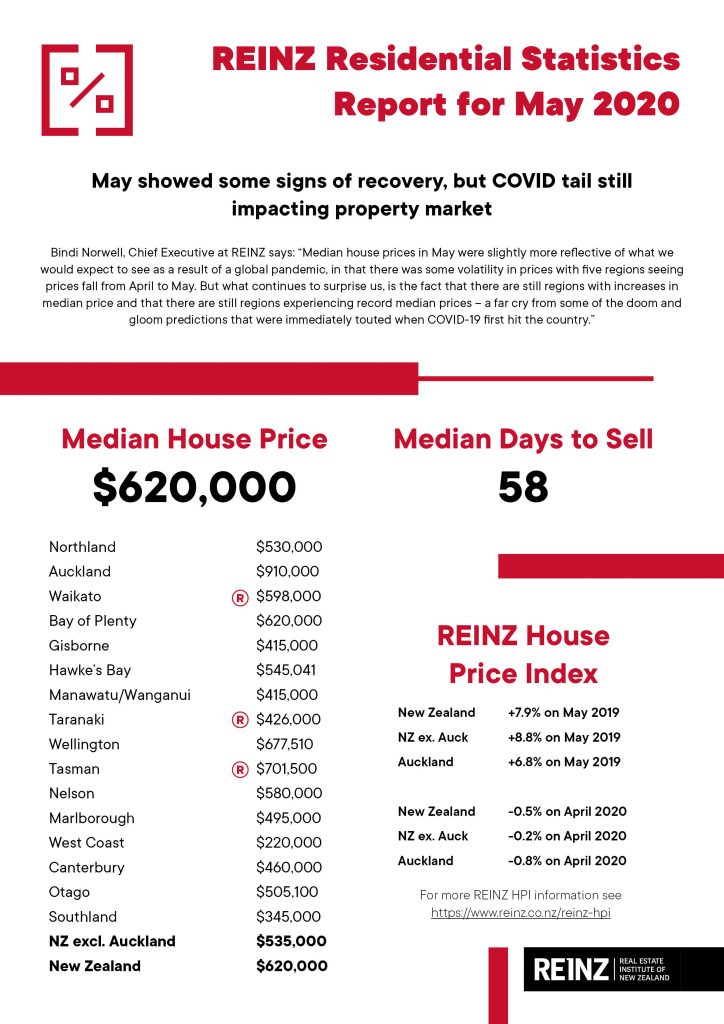
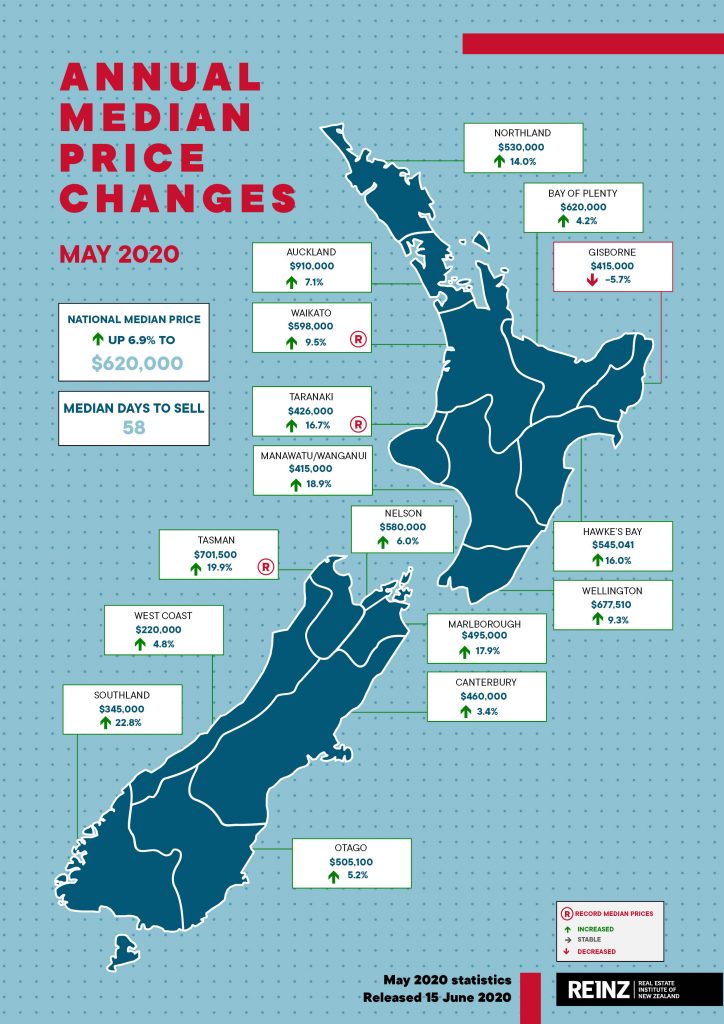
Median house prices across New Zealand increased by 6.9% in May to $620,000, up from $580,000 in May 2019.
Median house prices for New Zealand excluding Auckland increased by 9.4% to a median price of $535,000, up from $489,000 in May last year.
In Auckland, median house prices increased by 7.1% to $910,000 up from $850,000 at the same time last year – the third highest price on record.
However, median prices compared to April were quite mixed, with the country overall seeing an 8.8% drop compared to last month but 11 out of 15 regions saw monthly increases in median price.
Record median prices were recorded in:
- Waikato with a 9.5% increase to $598,000 up from $546,000 at the same time last year
- Taranaki with a 16.7% increase to $426,000 up from $365,000 at the same time last year – just $1,000 higher than the previous record median set in March this year
- Tasman with a 19.9% increase to $701,500 up from $585,000 at the same time last year.
“Median house prices in May were slightly more reflective of what we would expect to see as a result of a global pandemic, in that there was some volatility in prices with five regions seeing prices fall from April to May. But what continues to surprise us, is the fact that there are still regions with increases in median price and that there are still regions experiencing record median prices – a far cry from some of the doom and gloom predictions that were immediately touted when COVID-19 first hit the country.
“While it still may be too early for the full impact of price declines to be showing through, the reality is that the majority of regions in New Zealand (11 out of 16) saw median price increases from April to May and all bar one region (Gisborne) saw annual increases in price – likely a continuing effect of demand for good properties outstripping supply,” continues Norwell.
“Looking at the Auckland market, the region recorded its third highest median price on record, but prices were quite mixed looking across the Districts. Four Districts saw falls in price when compared to April (Auckland City, North Shore, Papakura and Waitakere) with the remaining three seeing lifts,” she continues.
“The listings shortage in the Wellington Region which has been evident for months now, has seen Wellington City hit a new record median price of $830,000; a $31,000 increase on April’s price and a $10,000 lift on the previous record median price set in October last year,” continues Norwell.
REINZ House Price Index (HPI)
The REINZ House Price Index for New Zealand, which measures the changing value of property in the market, increased 7.9% year-on-year to 2,962.
The HPI for New Zealand excluding Auckland increased 8.8% from May 2019 to 2,956 and Auckland’s HPI increased by 6.8% year-on-year to 2,970.
In May, Southland again had the highest annual growth rate with a 17.1% increase to 3,401. In second place was Manawatu/Wanganui with an annual growth rate of 16.7% to 3,555 and again in third place was Gisborne/Hawke’s Bay with a 16.6% annual increase to 3,164.
However, looking at the shorter-term picture to get a greater understanding of how COVID-19 impacted the underlying value of the market, there were no record high index levels recorded in May – the first time in 88 months.
The 1-month data showed that the underlying value in the market hasn’t fundamentally fallen with only minor decreases compared to April. The HPI for the country fell 0.5%, for New Zealand excluding Auckland it decreased 0.2% and Auckland’s HPI fell 0.8% compared to April.
Otago saw the biggest monthly fall with a 4.1% decrease compared to April. Waikato, Gisborne/Hawke’s Bay, Taranaki and Canterbury were the only regions with monthly increases compared to April showing that the price movements we are seeing in these regions is being driven by higher value being assigned to properties.
COVID now showing up in days to sell stats
In May, the median number of days to sell a property nationally increased by 17 days from 41 to 58 when compared to May 2019 – the highest days to sell in 111 months.
For New Zealand excluding Auckland, the median days to sell increased by 19 days from 38 to 57 – the highest days to sell for the month of May in 19 years.
Auckland saw the median number of days to sell a property increase by 16 days from 45 to 61 year-on-year – the highest days to sell for the month of May since records began.
Southland had the lowest days to sell of all regions at 50 days – up 18 days from the same time last year. Gisborne had the highest days to sell at 64 days, up 26 days on April’s figure.
Interestingly, Northland was the only region in the country to see a fall from April’s median days to sell.
“Last month we cautioned that the days to sell figure looked too good to be true, and now we have May’s data this was certainly the case. We would expect this to start returning to a more normal winter pattern over the next few months,” says Norwell.
Auctions still inhibited by COVID
With social distancing still impacting auctions during May, auctions were used in 7.1% of all sales across the country in May, with 284 properties selling under the hammer – down from 10.2% at the same time last year, when 762 properties were sold via auction.
Gisborne had the highest percentage of auctions across the country with 40.0% (14 properties) sold under the hammer, down from 44.9% (31 properties) in May 2019.
Auckland had the second highest percentage of auctions in New Zealand with 13.3% of properties (149 properties) sold under the hammer down from 17.9% at the same time last year (360 properties). This was followed by Bay of Plenty with 10.9% (28 properties) sold under the hammer down from 11.9% in May 2019 (64 properties).
Inventory
The total number of properties available for sale nationally decreased by -19.1% in May to 20,940 down from 25,895 in May 2019 – a decrease of 4,955 properties compared to 12 months ago and the lowest level of inventory for the month of May since records began.
Regions with the largest percentage decrease in total inventory levels were:
- Taranaki: -38.8% from 634 to 388 – 246 fewer properties
- Marlborough: -34.3% from 338 to 222 – 116 fewer properties
- Gisborne: -29.8% from 114 to 80 – 34 fewer properties
- Northland: -29.1% from 1,532 to 1,086 – 446 fewer properties.
Price Bands
The number of homes sold for less than $500,000 across New Zealand fell from 39.5% of the market (2,953 properties) in May 2019 to 33.1% of the market (1,320 properties) in May 2020.
The number of properties sold in the $500,000 to $750,000 bracket increased from 31.1% in May 2019 (2,323 properties) to 33.1% in May 2020 (1,319 properties).
At the top end of the market, the percentage of properties sold for $1 million or more increased from 13.5% (1,010 properties) in May 2019 to 15.2% (606 properties) in May 2020.
REINZ stats defy doom and gloom
“Real estate is still ahead on last year which is very encouraging all things considered. Any earlier doom and gloom has yet to be delivered, with housing demand still outstripping supply,” says Derryn Mayne, Owner of Century 21 New Zealand.
Her comments follow REINZ today releasing its Monthly Property Report for May which shows median house prices across New Zealand were up by 6.9%, compared to May 2019 – with Auckland up 7.1%. However, median prices compared to April were mixed, with the country seeing an overall drop. Nonetheless 11 out of 15 regions saw monthly median price increases.
“We knew the volume of sales would be well down on May last year, but what’s really encouraging is the huge surge we saw in house sales when lockdown restrictions lessened in May – with the number of houses selling nationwide lifting nearly 200% compared to April,” she says.
The Century 21 boss says the REINZ sales results for May will surprise many people.
“Sure, some prices have slipped in recent months, but overall median house prices are still comfortably up on this time last year for both Auckland and the rest of the country. At this point in time we’ve lost a couple months, but we certainly haven’t lost a year.”
Ms Mayne says three months ago some commentators were predicting a swift and severe property crash, but the latest numbers show most regions in New Zealand are still seeing monthly increases in median price, with some even achieving record median prices.
“We all know things will change. We just don’t know to what extent. These latest numbers, however, are the first real confirmation that overall prices have yet to change dramatically,” she says.
She acknowledges one thing that has changed is the time it now takes to sell a property. The median number of days to sell a property nationally increased by 17 days from 41 to 58 when compared to May 2019.
“Vendors need to be a little more patient, but the fact that prices are still holding up well is great news for homeowners. At the same time, we’re seeing some pockets of opportunity emerge for first-home buyers boosted by record-low interest rates and lower deposit requirements,” says Derryn Mayne.


