
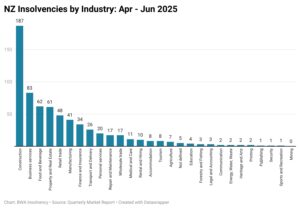
Construction continues to lead New Zealand’s insolvency statistics with 187 cases recorded in Q2 2025. Business services also saw a sharp rise in insolvencies, jumping 56 percent from Q1 to Q2. Retail trade followed with a 26 percent increase, while food and beverage, manufacturing, and property sectors saw modest declines

BWA Insolvency founder Bryan Williams
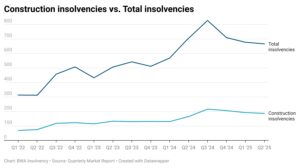
Figures from the latest BWA Insolvency Quarterly Market Report reveal that while overall insolvency numbers have plateaued, sector-specific pressures remain.
The construction sector has seen a 13 percent increase in business failures this quarter compared to Q2 2024, with cases dropping from 192 cases in Q1 2025 or 3 percent.
BWA Insolvency principal Bryan Williams says the construction sector is continuing to feel the brunt of economic challenges, with business services and retail trade also facing significant challenges.
“Despite a slight quarterly dip, construction insolvencies remain elevated. Project delays, cost overruns and cashflow constraints are still hitting builders and contractors hard,” says Williams.
“Many firms are operating on razor-thin margins. When one job falls over, it can trigger a domino effect.”
Williams says the data highlights the uneven nature of economic recovery.
“Some sectors are adapting and consolidating, while others are still under pressure. Insolvency trends are no longer just about macro conditions, it’s about how each industry is responding to change.”
While total insolvencies fell 1.6 percent from Q1 and 5.5 percent year-on-year, Williams cautions that the figures reflect a stabilisation at elevated levels, not a full recovery.
“We’re seeing a plateau, not a turnaround. Businesses are still vulnerable, especially those that haven’t adapted to new operating models.”
Williams says the rise of AI and digital tools is reshaping the business landscape.
“New entrants are leveraging technology to run leaner, more agile operations. That’s where growth is happening. Older businesses that haven’t evolved are struggling to keep up.”
Industry-specific insolvency trends
- Construction: down three percent from Q1, from 192 to 187, up 13 percent year-on year
- Business Services: up 57 percent from Q1, from 53 to 83, up 14 percent year-on-year
- Retail Trade: up 26 percent from Q1 from 38 to 48, up 33 percent year-on-year
- Food & Beverage: down 18 percent from Q1, from 76 to 62, up 24 percent year-on-year
- Manufacturing: down 16 percent from Q1, from 49 to 4, down two percent year-on-year
- Property & Real Estate: down 5 percent from Q1, from 64 to 6, down 34 percent year-on-year
Williams says early intervention remains critical: “Whether you’re in construction or consulting, the message is the same: seek help early. Waiting too long limits your options.”
Key Q2 2025 findings:
- Total insolvencies: 666 (down 1.6 percent from Q1, down 5.5 percent year-on-year
- Liquidations: 616 (down 3.6 percent from Q1, down 3.8 percent year-on-year
- Receiverships: 46 (up 35.3 percent from Q1, up 9.5 percent year-on-year
- Voluntary administrations: 4 (flat from Q1, down 82.6 percent year-on- year


