
The BWA Insolvency report shows Q3 total insolvencies rose five percent from the previous quarter, from 738 in Q2 to 777 in Q3. While this is six percent lower than the same period last year, the quarterly rise signals ongoing stress for businesses burdened by legacy debt and tighter credit conditions. Construction continues to dominate insolvency statistics with 192 cases this quarter slightly down from 197 in Q2 and 215 a year ago

Bryan Williams, Principal BWA Insolvency
BWA principal Bryan Williams says the data reflects a “game of two halves” in the economy.
“On one side, you’ve got irrepressible forward-looking indicators — share prices rising, real estate agents bouncing back, building permits up, and even ready-mix concrete demand forecasts improving,” says Williams.
“But then there’s the other half: companies weighed down by cost inflation, credit tightening, and enforcement for unpaid taxes. For those burdened with debt that earnings can’t service, the future is bleak.”
Williams warns that creditor behaviour is shifting toward what he calls “healthy destruction.”
“Creditors are accelerating the exit of firms that can’t recover. It’s a harsh reality, but it’s shaping the market,” he says.
Construction continues to dominate insolvency statistics with 192 cases this quarter, slightly down from 197 in Q2 and 215 a year ago. Williams says while the numbers look high, they need to be viewed in context.
“Construction is a $17 billion industry representing around 7 percent of GDP. It’s a large sector with many tributaries feeding thousands of families,” he says.
“Although it appears overrepresented in insolvency data, its failings are proportionally low compared to its economic weight, especially when you compare it to sectors like hospitality, which runs a close second in insolvency stakes but contributes far less to GDP.”
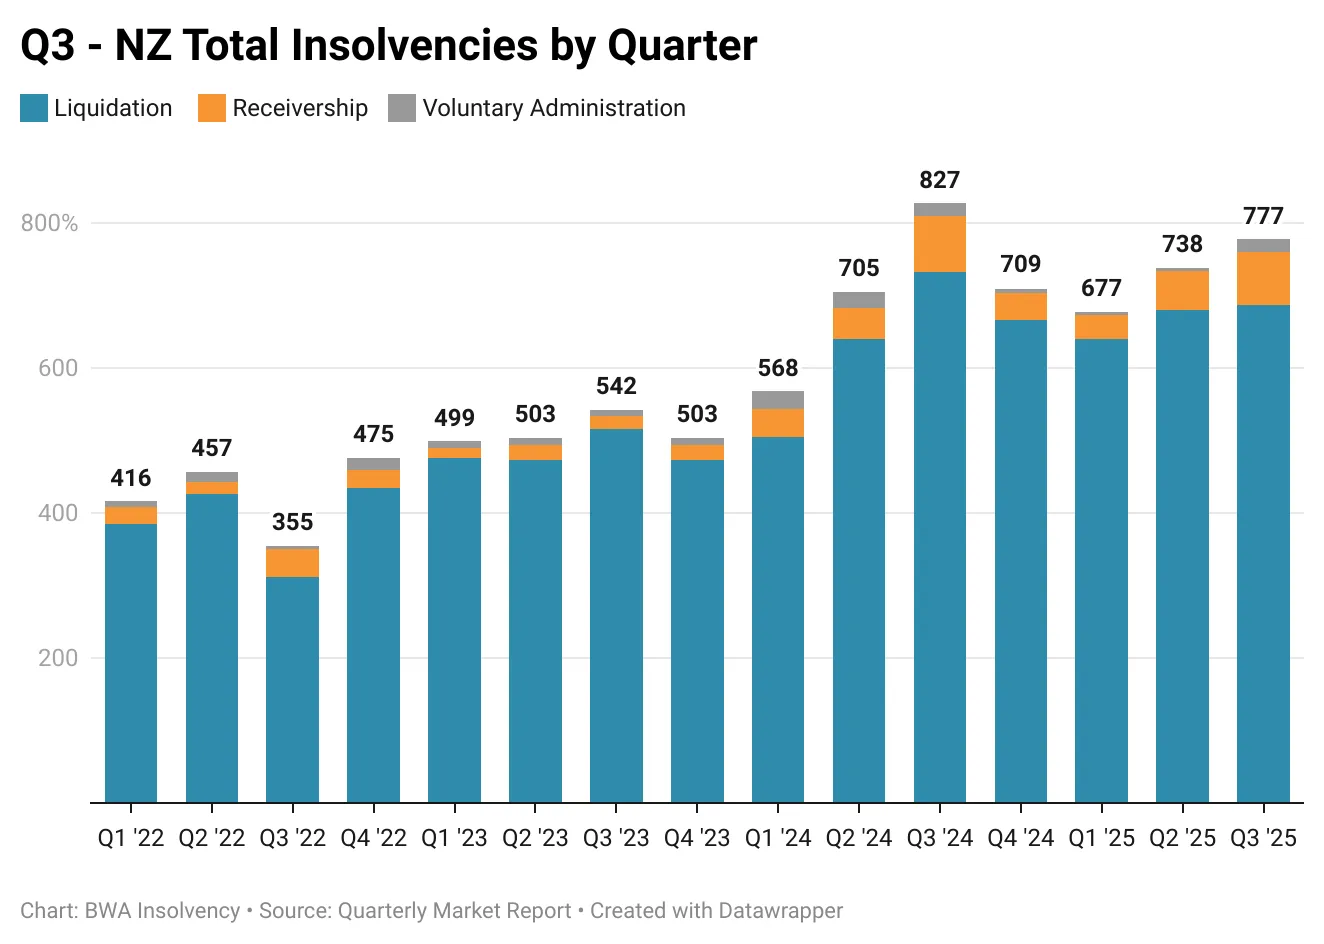
BWA Insolvency – NZ Insolvencies by Quarter to September 2025
Despite the pain, Williams sees a brighter future ahead. “Building permits rose 7.2 percent in September, and ready-mix concrete demand is forecast to grow by more than 8 percent annually. These are strong leading indicators. In the coming months, we expect a reversal of the recent contraction and new activity to become evident,” he says.
While construction remains the largest contributor, the sharpest increases came from transport and delivery (up 29 percent from Q2 and 40 percent year-on-year), manufacturing (up 21 percent from Q2 and 37 percent year-on-year), and food and beverage (up 15 percent from Q2 and 27 percent year-on-year).
“Transport operators are squeezed by fuel and compliance costs, manufacturers by input prices, and hospitality by discretionary spending patterns. These pressures are structural, not just cyclical,” says Williams.
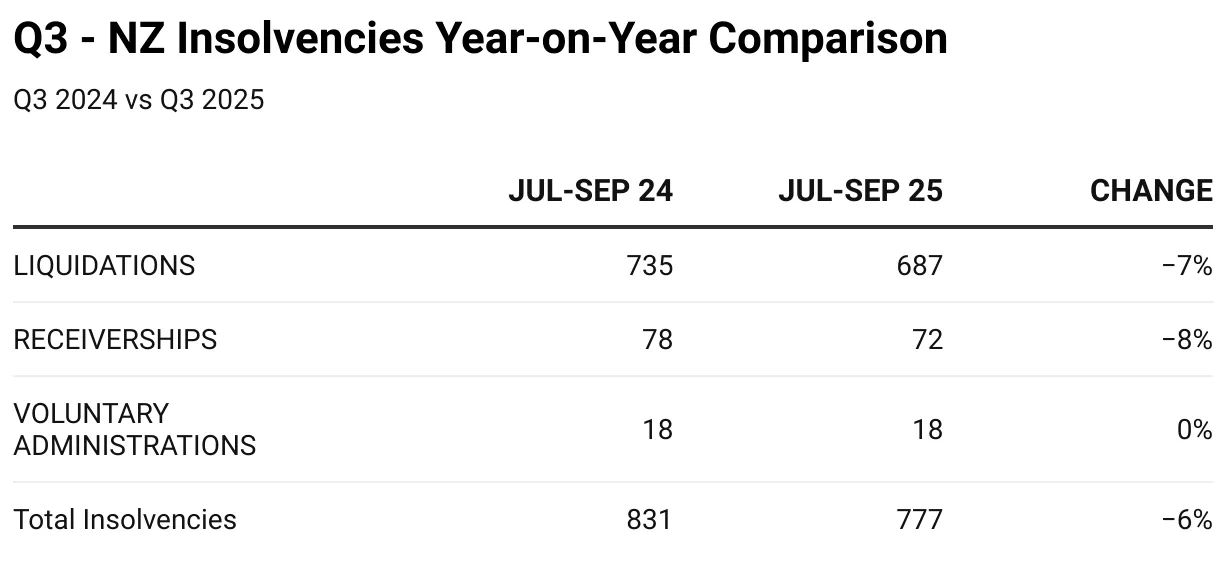
BWA Insolvency – NZ Insolvencies year-on-year comparison
Williams says optimism is returning to the broader economy. “Interest rate cuts and stabilising costs are fuelling confidence that the economy is entering an upward phase,” he says.
“New Zealand is a small economy but a powerful one. With strong systems, technology infrastructure, and Kiwi ingenuity, businesses are capable of leading the economy to a new level of prosperity.”
Williams cautions that external risks remain, including geopolitical tensions and trade policy uncertainty, but says the fundamentals are strong.
“If tensions ease and trade barriers fall, investment will return. If they escalate, enthusiasm will dampen. But the underlying capacity for growth is there,” he says.
The full Quarterly Market Report is available here.
Key Q3 2025 findings
- Total insolvencies: 777 (up 5 percent from Q2, down 6 percent year-on-year)
- Construction: 192 cases (down 3 percent from Q2, down 11 percent year-on-year)
- Transport & delivery: 49 cases (up 29 percent from Q2, up 40 percent year-on-year)
- Manufacturing: 52 cases (up 21 percent from Q2, up 37 percent year-on-year)
- Food & beverage: 76 cases (up 15 percent from Q2, up 27 percent year-on-year)
