
Decreasing sales activity and easing price growth are some early indications from REINZ’s latest figures for January


Across New Zealand, the number of residential property sales decreased 28.6% in January 2022, from 5,135
in January 2021 to 3,665.
While market activity is expected to reduce over the holiday period, when we look at the seasonally adjusted figures there is a 5.3% decrease from December to January. Allowing for the usual seasonal trends, this January is weaker than a typical first month of the year.
The sales count for New Zealand excluding Auckland, decreased 26.4% annually from 3,184 to 2,342.
Excluding April 2020, which was heavily affected by the first COVID-19 Alert Level 4 lockdown, this was the
lowest sales count for New Zealand and New Zealand excluding Auckland since January 2011.
These figures are reflective of the usual slow down in activity over this period, perhaps magnified by more people focusing on the holidays following extended COVID-19 restrictions and headwinds such as LVRs, the CCCFA and interest rates impacting the number of active buyers in the market.
Three regions bucked this trend and saw an annual percentage increase in sales:
• Wellington increased 9.0% annually from 290 to 316
• Marlborough increased 7.7% from 39 to 42
• Hawke’s Bay increased 2.5% annually from 121 to 124.
Auckland saw the number of properties sold decrease 32.2% annually — from 1,951 in January 2021 to 1,323
in January 2022. The regions with the greatest annual percentage decrease in sales volumes were:
• West Coast, which decreased 55.4% annually from 56 to 25
• Northland, which decreased 36.6% annually from 172 to 109
• Canterbury, which decreased 36.4% annually from 783 to 498.
In terms of the January month, this is the lowest sales count since records began in 1992 for Nelson, Otago,
Taranaki and Manawatu/Whanganui, and the lowest for Tasman since 2000.
In January, listings were down 1.7% across Aotearoa, indicative of a slowdown in the number of sales. The
reduction in listings was driven by Auckland — for New Zealand excluding Auckland there was a 5.4%
increase.
Jen Baird, Chief Executive at REINZ, says: “In January, we expect to see activity in the residential property
market slow and prices ease due to the summer holidays. The number of residential property sales
decreased 28.6% in January 2022 compared to January 2021. When compared to December, the sales count
was down 48.2%, which is to be expected as we move from December into January. However, in seasonally
adjusted terms, this is still a 5.3% decrease, which shows that this January’s sales volumes are weaker than is
usually expect for a January.
“Most regions report the move to the Red traffic light setting has had less of an impact on activity, and out
of town enquiry has been restored. However, feedback from agents across the country suggests a decrease
in the number of first home buyers and investors in the market, noting quieter auction rooms and open
homes.
“Many point to access to finance, exacerbated by changes introduced in December to the Credit Contracts
and Consumer Finance Act (CCCFA) — currently under review, as having a major impact.
“This is a sentiment echoed in a survey conducted at the end of January by economist Tony Alexander in collaboration with REINZ, which noted that the predominant concern for buyers is no longer availability of stock but rather financing.
“While hard evidence is lacking in terms of the impact of the CCCFA, data from Centrix, a New Zealand credit
reporting agency, found the percentage of home loan applications that were approved dropped from 39% in October to 30% after December. The longer-term impact will be seen in the numbers of buyers in the market
in coming months.
“Looking forward, we would expect sales volumes to increase as we head into February and March. However, this does depend on reasonable levels of new listings.”
Median residential property prices hold, growth rate eases
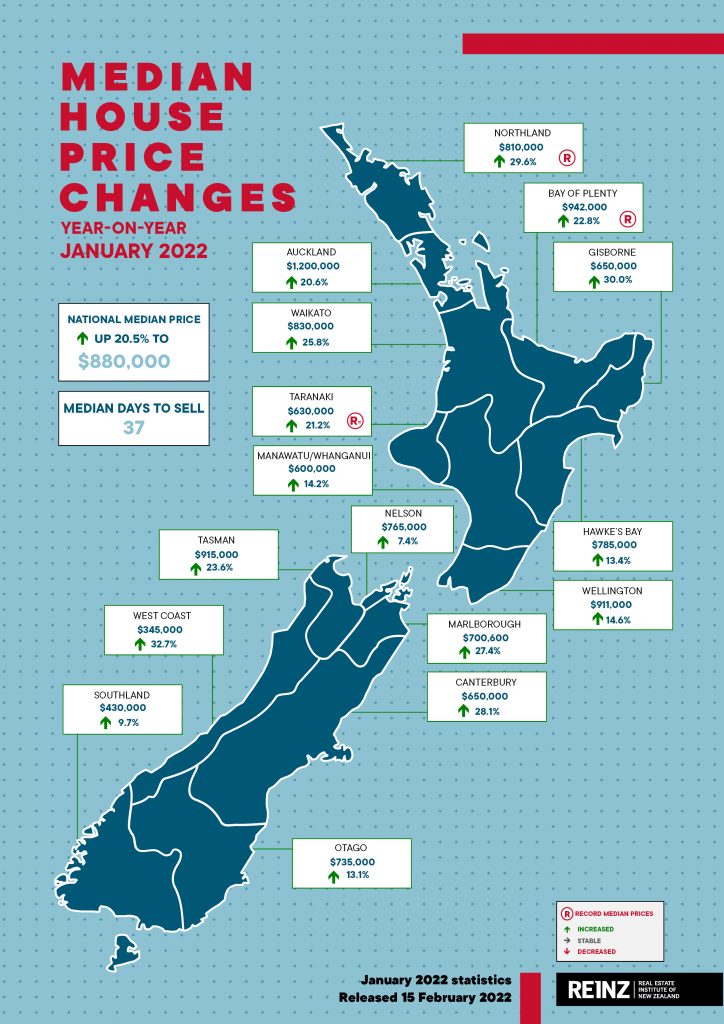
Median prices for residential property across New Zealand increased 20.5%, from $730,300 in January 2021
to $880,000 in January 2022. While median prices were down 2.2% compared to December ($900,000),
REINZ’s seasonally adjusted figures indicate prices held up slightly better than we would usually expect when
moving from December to January, showing a 1.4% increase.
The median residential property price for New Zealand excluding Auckland increased 24.6% from $602,000
in January 2021 to $750,000.
Auckland’s median residential property price increased 20.6% annually, from $995,000 in January last year
to $1,200,000 — down 6.3% on December. The seasonally adjusted figures show a marginal decrease from
December to January of 0.3%. Two districts in Auckland reached record median prices: Franklin District
($1,050,000) and Rodney District ($1,350,000).
In January, two regions achieved record medians and one saw a record equal:
• Northland increased 29.6% annually from $625,000 to $810,000 — a new record median high for
the third month running. Additionally, Kaipara District ($1,000,000) and Whangarei District
($810,000) reached record medians
• Bay of Plenty increased 22.8% annually from $767,000 to $942,000 — a new record median high.
Additionally, Opotiki District ($666,000) and Whakatane District ($878,000) reached record medians
• Taranaki increased 21.2% annually from $520,000 to $630,000 — an equal record median to that
previously reached in October 2021. Additionally, South Taranaki District ($515,000) reached a
record median.
All regions showed annual price growth — most double-digit percentage growth. Only Nelson and Southland
saw annual growth less than 10% at 7.4% and 9.7% respectively.
“Median sales prices across New Zealand saw an annual uplift of 20.5% on the same time last year. The
median price tends to drop in January, however, REINZ’s seasonally adjusted figures showed a 1.4% increase
as we moved from December into January.
“The New Zealand housing market continues to show annual price growth, and we saw two regions reach
record medians and one a record equal in January. Adding to that, 14 districts achieved record median
prices.
“While we do note a deceleration in the rate of price growth, it does follow a particularly strong year.
Historically low interest rates and a supply deficit saw heightened demand and kept house prices rising
through 2021. However, with the Reserve Bank increasing interest rates, inflation rates being at their highest
in 30 years, tighter lending conditions, and Government regulation, market dynamics are shifting,” says
Baird.
REINZ HPI: house value increases show deceleration
The REINZ House Price Index (HPI) for New Zealand, which measures the changing value of residential
property nationwide, showed an annual increase of 19.9% from 3,474 in January 2021 to 4,164. This was a
1.5% decrease from December and down 2.6% from its peak in November.
The HPI for New Zealand excluding Auckland showed an annual increase in house values of 20.8% from
3,509 in January 2021 to 4,239 in January 2022. This was a 0.8% decrease month on month.
Six regions reached new highs on the index:
• Canterbury increased 32.7% annually to 3,854
• Northland increased 28.3% annually to 4,414
• Bay of Plenty increased 23.4% annually to 4,443
• Taranaki increased 23.3% annually to 4,755
• Southland increased 20.1% annually to 4,666
• Tasman/Nelson/Marlborough/West Coast increased 19.5% annually to 3,445.
Canterbury has had the top annual HPI movement for three months in a row, reflecting the underlying
strength of property values in the market. Comparatively, Otago and Wellington have sat in the bottom two
over the same period. While this is new for Wellington, Otago has spent 17 of the last 21 months in the
bottom two annual HPI movements, which suggests that value growth in the in Otago is weaker compared
to other regions.
“While we continue to see annual growth in the HPI — up 19.9% from the same period last year — we do
note a reduction in the rate of increase. To put this into perspective, the underlying strength of the housing
market value remains, however, market conditions are changing,” Baird says.
“Last year low interest rates and listings combined with high demand made for a highly competitive market.
New regulations, higher interest rates, and tighter lending criteria, are having an impact and buyers are
being more cautious around price when purchasing,” Baird observes.
Annual increase in median days to sell
Across New Zealand, the median number of days it took to sell a property increased two days to 37 in
January 2022, while the median days to sell increased by four days to 39 for New Zealand excluding
Auckland.
Properties sold fastest on the West Coast at 28 days — up three days on last year and the only region with a
median of less than 30. On the other side of the spectrum, Wellington had the highest median days to sell at
49 days — up 11 days from January 2021 and the region’s highest since May 2020.
Levels of inventory continue to increase
In January 2022, the total number of properties available for sale nationally increased 28.5% as more
homeowners chose to list their homes for sale, increasing from 15,480 in January 2021 to 19,897 — and an
uplift of 18.6% on December’s inventory levels.
All regions showed an annual increase in inventory levels bar one. The West Coast saw a decrease of 23.0%
compared to January 2021 — from 213 to 164.
There were some significant increases. Both Manawatu/Whanganui and Wellington recorded over twice as
much inventory in January 2022 compared to the same period last year, with increases of 121.3% and
111.6% respectively.
“Inventory levels across New Zealand were low throughout 2021, increasing competition. More homes
coming on to the market typically changes market dynamics — more choice for buyers, fewer competing
offers and more leverage in negotiations.
“There are several reasons for the increase, including home values enticing people to sell, people choosing
to sell homes in high-value areas and relocate enabled by flexible working, and as inventory increases,
owners are more confident they can sell and then find a suitable replacement home,” Baird says.
Inventory data comes from realestate.co.nz.
Auction rooms see drop in footfall
January saw 530 properties sold by auction across New Zealand, 14.5% of all properties sold — down from
15.6% at the same time last year. This is a notable change compared to December 2021, when 30.5% of sales
were by auction, and is the lowest auction percentage since July 2020.
The percentage of sales by auction recorded in New Zealand excluding Auckland shows a similar trend; in
January, 6.9% of sales were by auction compared to 8.8% in January 2021 —the lowest auction percentage
since June 2020.
The highest percentage of sales by auction was in Auckland at 27.8% (368) — up 1% on the same time last
year. Bay of Plenty had the second highest figure, with 18.7% (42) of properties sold by auction, followed by
Northland where 14.7% of sales were by auction.
“Auctions have become an increasingly popular method of sale in New Zealand and over 2021 we saw
increased numbers of vendors opting to put their properties under the hammer. In January, we would
expect to see relatively moderate auction room activity during and immediately following the holiday period,
with numbers increasing in February and into March.
“However, we did observe a decrease in some regions. Most notably in Gisborne, where the percentage of
auctions decreased from 33.3% in January 2021 to 4.5% in January 2022. Anecdotally, feedback in the region
suggests that current prices and access to finance has seen fewer buyers in the market,” Baird concludes.


