
Despite a 78.5% decrease in sales volumes in April, median house prices across New Zealand increased by 17.2% to a new record high of $680,000, according to the latest data from the Real Estate Institute of New Zealand (REINZ)
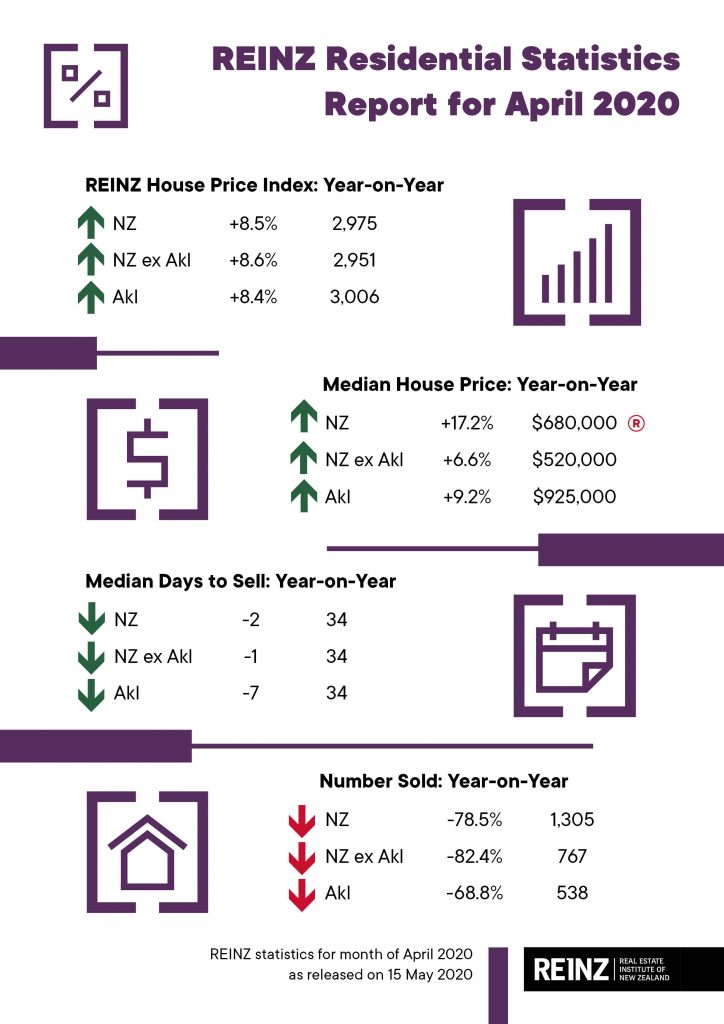
The number of properties sold in April across New Zealand decreased by -78.5% from the same time last year – from 6,082 to 1,305 – as the level 4 lockdown made it very difficult for property sales to occur.
For New Zealand excluding Auckland, the number of properties sold decreased by -82.4% when compared to the same time last year (from 4,357 to 767).
In Auckland, the number of properties sold in April decreased by -68.8% year-on-year (from 1,725 to 538).
Unsurprisingly, there were no regions with increases in sales volumes during April. However, the West Coast was the only region not to experience a record low during April.
Regions with the largest decrease in annual sales volumes during April were:
- Southland: -92.1% (from 140 to 11 – 129 fewer houses)
- Nelson: -91.6% (from 83 to 7 – 76 fewer houses)
- Manawatu/Wanganui: -87.2% (from 384 to 49 – 335 fewer houses)
- Gisborne: -86.6% (from 67 to 9 – 58 fewer houses).
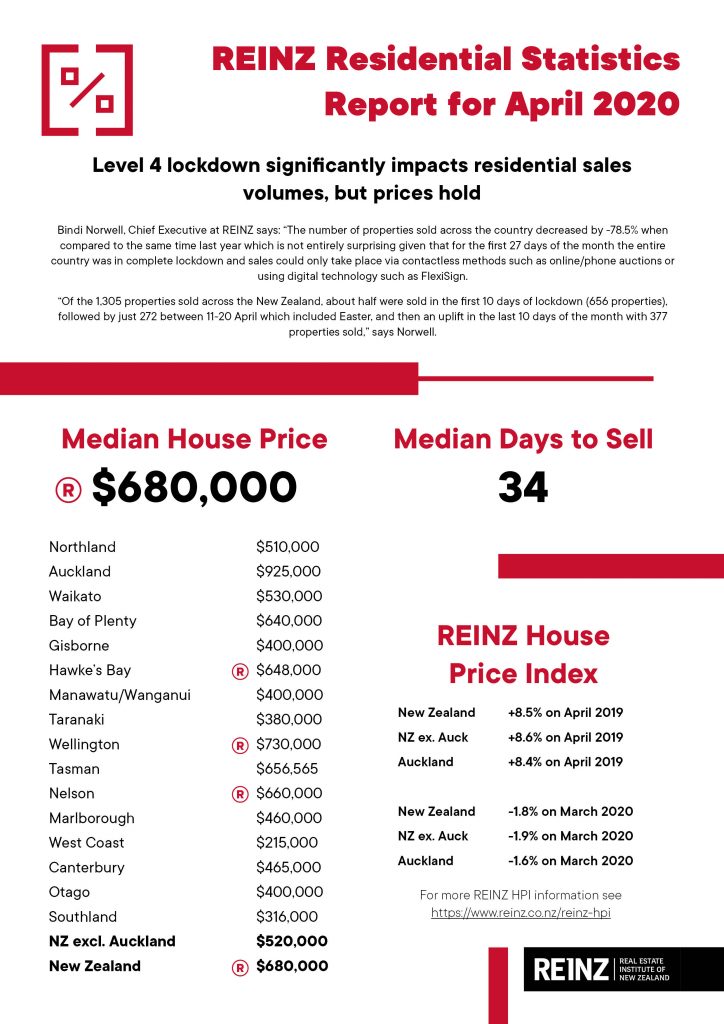
Bindi Norwell, Chief Executive at REINZ says: “The number of properties sold across the country decreased by 78.5% when compared to the same time last year which is not entirely surprising given that for the first 27 days of the month the entire country was in complete lockdown and sales could only take place via contactless methods such as online/phone auctions or using digital technology such as FlexiSign.
“Of the 1,305 properties sold across New Zealand, about half were sold in the first 10 days of lockdown (656 properties), followed by just 272 between 11-20 April which included Easter, and then an uplift in the last 10 days of the month with 377 properties sold,” says Norwell.
“What did surprise us, was that April was not the lowest monthly sales count on record for the West Coast. There were a few months in the 1990s where the region had less than the 9 sales experienced in April,” points out Norwell.
“The Auckland region appeared to be the least impacted by COVID-19 when it came to sales volumes, with a 68.8% drop in the number of properties sold. Most of the sales occurred in Auckland City (172,) followed by North Shore City (102) and Manukau City (92). On the flipside, Southland was the most impacted with a 92.1% annual fall,” she continues.
“Key to moving forward and helping the market to recover will be the number of new listings coming onto the market during May and consumer confidence levels – particularly in relation to ongoing employment and people’s ability to access finance. Lastly, we’ll be looking at metrics such as the sales price to CV ratio, percentage of auctions and median number of days to sell.
“Talking to our members around the country, there are good levels of activity starting to occur with both first time buyers and investors active in the market which is a positive sign. We expect this to pick up as we move into Level 2,” she continues.
“However, we caution over being too optimistic until we get a few more months’ data, as many of the sales in April will have been negotiated during March, so it’s likely to be another month or so until we really see the full impact of the lockdown,” warns Norwell.
Record median prices continued in April
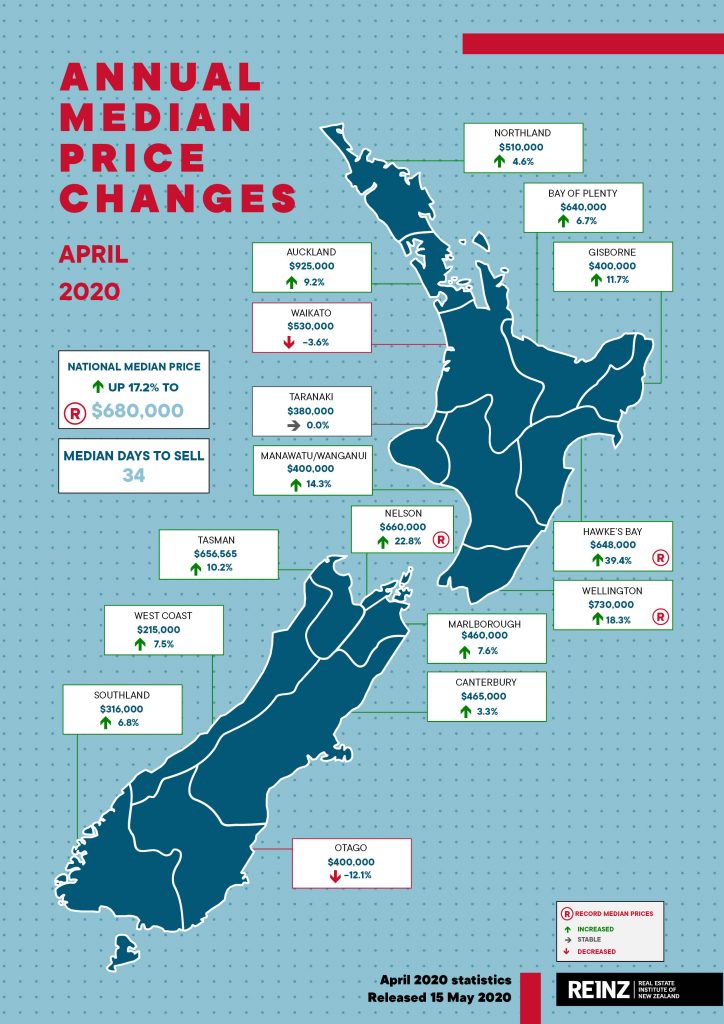
Despite the decrease in sales volumes, median house prices across New Zealand increased by 17.2% in April to a new record high of $680,000, up from $580,000 in April 2019.
Median house prices for New Zealand excluding Auckland increased by 6.6% to a median price of $520,000, up from $488,000 in April last year.
In Auckland, median house prices increased by 9.2% to $925,000 up from $847,000 at the same time last year – the second highest price on record.
Record median prices were recorded in:
- Hawke’s Bay with a 39.4% increase to $648,000 up from $465,000 at the same time last year – the first time the median price has gone over the $600,000 mark and a $103,000 uplift from March
- Wellington with an 18.3% increase to $730,000 up from $617,077 at the same time last year
- Nelson with a 22.8% increase to $660,000 up from $537,500 at the same time last year.
“Median prices during April were less volatile than we anticipated, especially with such a significant drop in sales volumes, with median prices for the country showing a 17.2% uplift on the same time last year to a record median high of $680,000. Additionally, all bar 3 regions (Waikato, Taranaki and Canterbury) saw annual uplifts in median house prices,” says Norwell.
“It looks as if the continued listings shortage has helped prices hold during April, however, as many of these sales will have been negotiated during March when confidence levels were higher than they are now, it’s important to take this into consideration when looking at the figures,” continues Norwell.
“We were surprised to see three regions with record median prices in April (Hawke’s Bay, Wellington and Nelson), but looking into the detail of these regions, it’s more to do with uplifts in the upper sales price brackets than an uplift in the underlying value in these regions. However, time will tell what the true impact has been,” she points out.
“Looking at the Auckland market, the region recorded its second highest median price on record. This was the result of a 9-percentage point increase in $1 million plus sales and record median prices in Papakura District ($735,000) and Waitakere District ($875,000),” continues Norwell.
REINZ House Price Index (HPI)
The REINZ House Price Index for New Zealand, which measures the changing value of property in the market, increased 8.5% year-on-year to 2,975.
The HPI for New Zealand excluding Auckland increased 8.6% from April 2019 to 2,951 and Auckland’s HPI increased by 8.4% year-on-year to 3,006.
In April, Southland had the highest annual growth rate with a 21.1% increase to 3,426. In second place was Manawatu/Wanganui with an annual growth rate of 18.6% to 3,603 and again in third place was Gisborne/Hawke’s Bay with a 15.4% annual increase to 3,111.
However, looking at the shorter-term picture to get a greater understanding of how COVID-19 impacted the underlying value of the market, the 1-month data showed a -1.8% decrease in the HPI for the country. New Zealand excluding Auckland decreased -1.9% and Auckland’s HPI fell -1.6% compared to March.
Waikato and Canterbury saw the biggest monthly falls both with a -3.8% decrease compared to March and Northland saw the biggest monthly increase with a 1.1% uplift compared to March.
Days to sell remains steady – for now
In April the median number of days to sell a property nationally decreased by 2 days from 36 to 34 when compared to April 2019 – the lowest days to sell for the month of April in 3 years.
For New Zealand excluding Auckland, the median days to sell decreased by 1 day from 35 to 34 – the lowest days to sell for the month of April in 3 years.
Auckland saw the median number of days to sell a property fall by 7 days from 41 to 34 year-on-year – the lowest days to sell for the month of April in 4 years.
Manawatu/Wanganui and Marlborough had the lowest days to sell of all regions at 22 days – down 6 and 21 days respectively from the same time last year. For Manawatu/Wanganui it was the lowest median number of days to sell for the month of April ever and for Marlborough it was the lowest median days to sell for 13 years (April 2007).
The Taranaki region has now had a median number of days to sell of less than 30 days for 7 months in a row and April’s figure was the lowest for the month of April since records began.
Northland again had the highest days to sell of any region at 71 days, up 20 days on April 2019, and up 19 days on March’s figure of 52. West Coast had the second highest median days to sell across the country at 63 days, down 24 days on the same time last year and the lowest for the month of April for 8 years.
“While on the surface the median number of days to sell looks pretty healthy for an April month, and the shortage of listings will have helped reduce the overall figure, I think we need to just be a bit cautious in these early days until we can get a clearer picture of this measure,” concludes Norwell.
Physical distancing requirements sees drop in auctions
With only online or phone auctions allowed during the Alert Level 4 lockdown, many regions held no auctions during April. However, auctions were still used in 7.9% of all sales across the country in April, with 103 properties selling under the hammer – down from the same time last year, when 11.5% of properties (701) were sold via auction.
Auckland had the highest percentage of auctions across the country with 18.2% (98 properties) sold under the hammer, down from 20.8% (359 properties) in April 2019.
Marlborough had the second highest percentage of auctions in New Zealand with 7.1% of properties (1 home) sold under the hammer up from 1.3% at the same time last year (1 home). This was followed by Otago with 4.0% (2 properties) sold under the hammer down from 7.4% in April 2019 (26 properties).
Inventory
The total number of properties available for sale nationally decreased by -29.3% in April to 19,702 down from 27,858 in April 2019 – a decrease of 8,156 properties compared to 12 months ago and the lowest level of inventory for the month of April since records began.
Regions with the largest percentage decrease in total inventory levels were:
- Marlborough: -44.2% from 382 to 213 – 169 fewer properties
- Taranaki: -43.2% from 683 to 388 – 295 fewer properties
- Northland: -36.1% from 1,635 to 1,045 – 590 fewer properties
- Waikato: -32.7% from 2,147 to 1,446 – 701 fewer properties.
Wellington had the lowest number of weeks’ inventory with 9 weeks inventory available to prospective purchasers, down on last year’s figure of 10 weeks.
This was followed by Hawke’s Bay and Manawatu/Wanganui with 10 weeks’ inventory available to prospective purchasers.
West Coast had the highest number of week’s inventory with 96 weeks’ inventory available to prospective purchasers. Northland was the next highest with 41 weeks’ inventory available.
Price Bands
The number of homes sold for less than $500,000 across New Zealand fell from 39.0% of the market (2,374 properties) in April 2019 to 29.7% of the market (387 properties) in April 2020.
The number of properties sold in the $500,000 to $750,000 bracket decreased from 31.7% in April 2019 (1,927 properties) to 28.3% in April 2020 (369 properties).
At the top end of the market, the percentage of properties sold for $1 million or more increased from 13.6% (827 properties) in April 2019 to 21.6% (282 properties) in April 2020. This is the highest percentage of sales sold for more than $1 million since records started in 1992.
For Regional Information and Commentary click here
For further information, contact Dee Crooks, Head of Communications at REINZ, on 021 953 308.


