October saw the highest number of properties sold in nearly five years as 10 regions saw record median house prices, including Auckland which has now hit $1,000,000, the Real Estate Institute of New Zealand (REINZ) reports
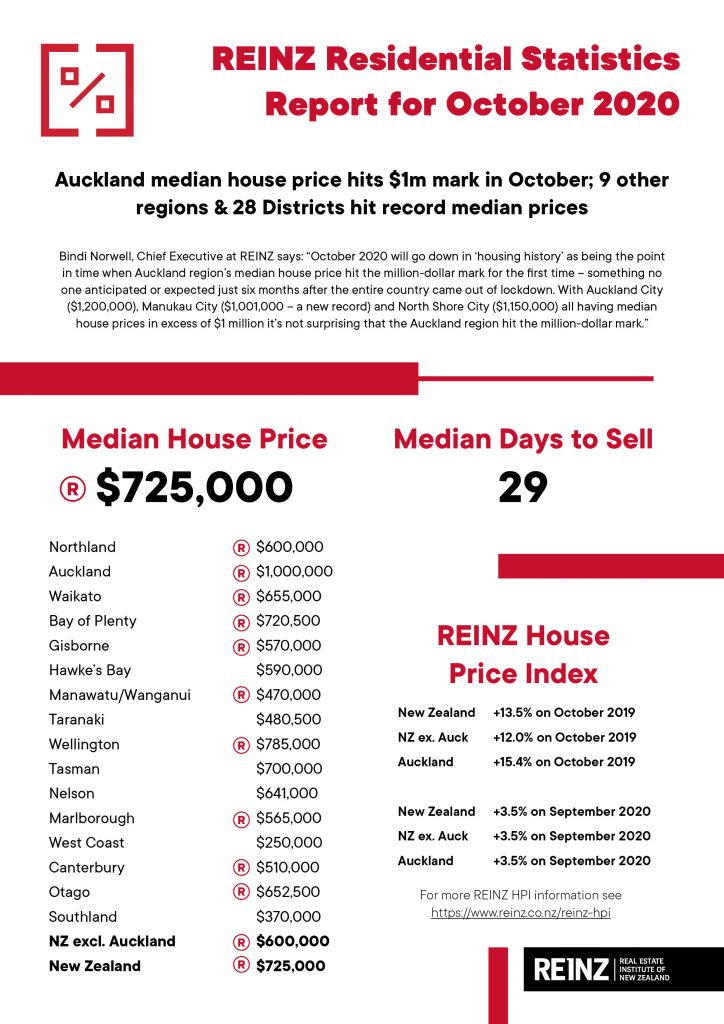
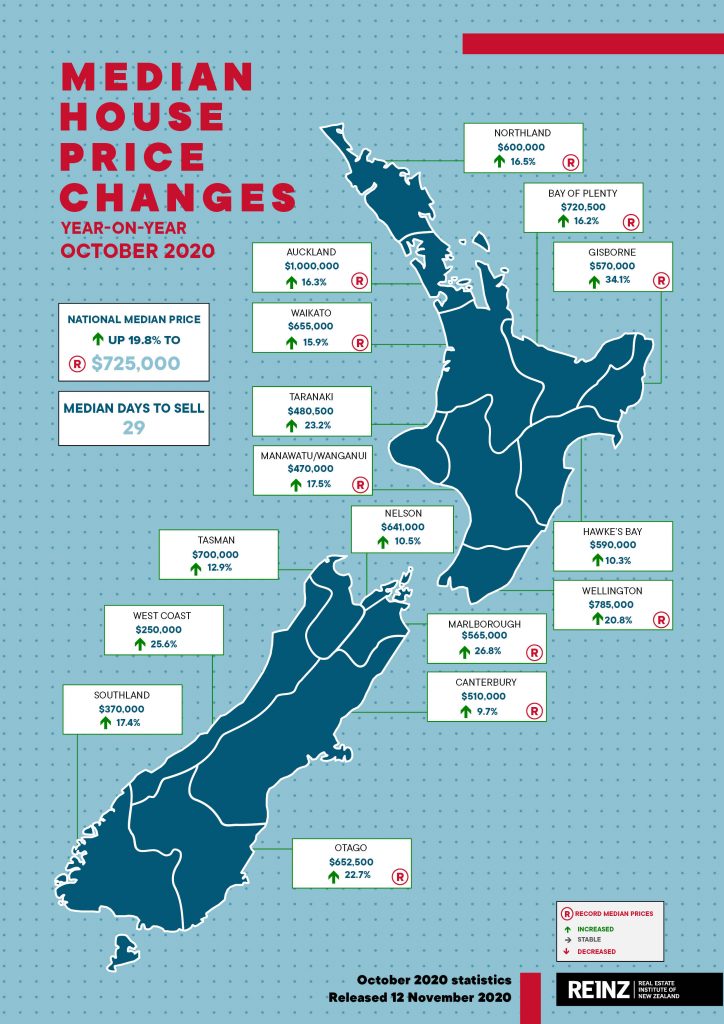
Median house prices across New Zealand increased by 19.8% from $605,000 in October 2019 to a new record median high of $725,000 in October 2020; and up from $689,000 in September this year (a 5.2% lift).
Median house prices for New Zealand excluding Auckland increased by 15.4% from $520,000 in October last year to a new record median price of $600,000, and up from $585,000 in September this year (a 2.6% increase).
Additionally, Auckland’s median house price increased by 16.3% from $860,000 at the same time last year to $1,000,000 a new record high, and up from $955,000 in September this year (a 4.7% increase).
In total 10 regions saw record median prices during October. Regions in addition to Auckland with record median prices were:
- Gisborne with a 34.1% increase from $425,000 in October last year to $570,000 this October
- Marlborough with a 26.8% increase from $445,500 in October last year to $565,000 this October
- Otago with a 22.7% increase from $532,000 in October last year to $652,500 this October
- Wellington with a 20.8% increase from $650,000 in October last year to $785,000 this October
- Manawatu/Wanganui with a 17.5% increase from $400,000 in October last year to $470,000 this October
- Northland with a 16.5% increase from $515,000 in October last year to $600,000 this October
- Bay of Plenty with a 16.2% increase from $620,000 in October last year to $720,500 this October
- Waikato with a 15.9% increase from $565,000 in October last year to $655,000 this October
- Canterbury with a 9.7% increase from $465,000 in October last year to $510,000 this October.
Bindi Norwell, Chief Executive at REINZ says: “October 2020 will go down in ‘housing history’ as being the point in time when Auckland region’s median house price hit the million-dollar mark for the first time – something no one anticipated or expected just six months after the entire country came out of lockdown. With Auckland City ($1,200,000), Manukau City ($1,001,000 – a new record) and North Shore City ($1,150,000) all having median house prices in excess of $1 million it’s not surprising that the Auckland region hit the million-dollar mark.
“While this is a significant milestone, it raises serious questions around future affordability for Auckland residents wanting to get a foot on the property ladder. It also highlights just how important it is that legislation, such as the RMA, is re-addressed quickly by the current government so it is fit for purpose to help support more houses being built at speed and at scale,” says Norwell.
“In addition to Auckland, 9 other regions and 28 districts around the country saw house prices reach new record medians in October showing how low interest and mortgage rates, the diversion of spend on overseas travel to property, expats returning home, the removal of LVRs and a fiercely competitive market due to the lack of listings has been contributing to price rises over the past few months,” she continues.
“While every region in the country saw price rises, regions of particular note included Manawatu/Wanganui which had a record median price of $470,000 and 5 districts with record medians; Waikato with a record median price of $655,000 and 4 districts with record medians and Wellington with a record median price of $785,000 and 6 districts with record medians. Also, Rotorua District ($580,000), Tauranga City ($810,000), Lower Hutt ($761,000) and South Taranaki ($345,034) have had record median prices for 3 months in a row now and Christchurch City ($526,000) has had a record median for 2 months in a row.
“Given the price rises we’ve seen over the past few months, we wouldn’t be surprised if the Reserve Bank goes ahead with its proposal to reinstate LVRs before the 12-month period is up – particularly for investors,” points out Norwell.
Highest number of properties sold in NZ in 53 months
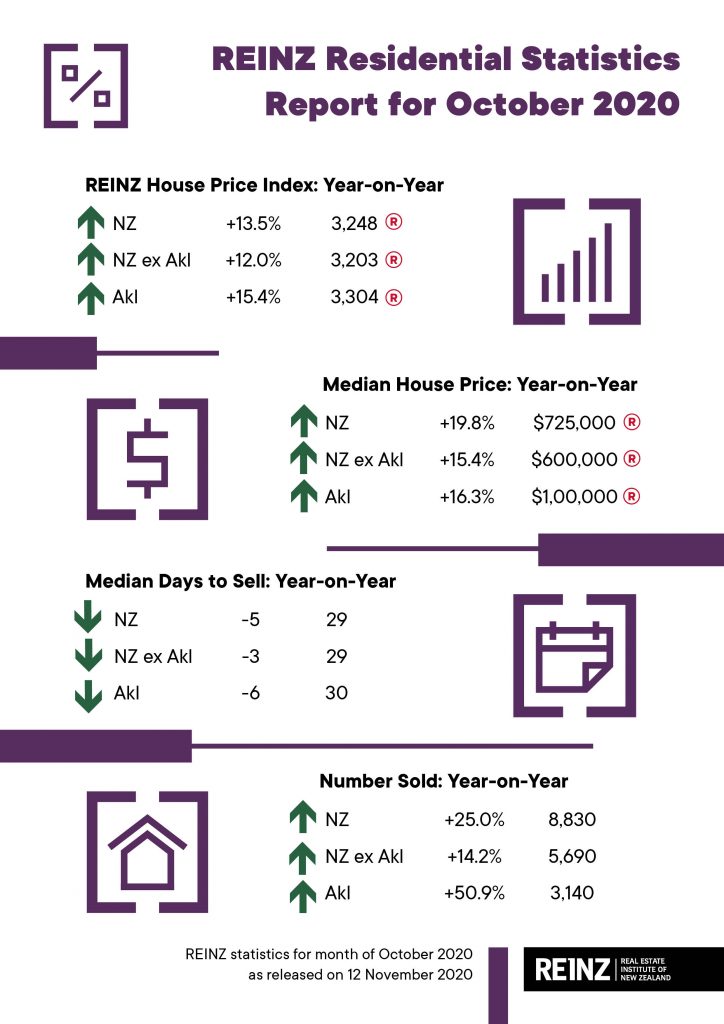
The number of residential properties sold in October across New Zealand increased by 25.0% from the same time last year (from 7,063 to 8,830) – the highest number of properties sold in 53 months (May 2016) and the highest October sales count since October 2006 (14 years).
For New Zealand excluding Auckland, the number of properties sold increased by 14.2% when compared to the same time last year (from 4,982 to 5,690) – the highest number of properties sold since March 2017 (43 months) and the highest October sales volumes since October 2006 (14 years).
In Auckland, the number of properties sold in October increased by 50.9% year-on-year (from 2,081 to 3,140) – the highest since March 2015 (67 months) and the highest October sales volumes since October 2003 (17 years).
In addition to Auckland, regions with the largest increase in annual sales volumes during October were:
- Gisborne: +43.2% (from 44 to 63 – 19 more houses) – the highest for the month of October since October 2005 (15 years)
- Waikato: +30.4% (from 737 to 961 – 224 more houses) – the highest sales volumes for the region in 53 months and the highest for the month of October in 17 years
- Marlborough: +29.3% (from 82 to 106 – 24 more houses) – the highest sales volume in 24 months
- West Coast: +28.2% (from 39 to 50 – 11 more houses) – the highest for an October month in 5 years
- Taranaki: +24.5% (from 159 to 198 – 39 more houses) – the highest for an October month in 14 years
- Southland: +23.2% (from 177 to 218 – 41 more houses) – the highest for an October month in 13 years.
Only one region, Nelson, saw an annual decrease in sales volumes with the number of properties sold in October falling by just one property from 102 in October 2019 to 101 this October. Wellington’s sales volumes remained flat at 750 properties sold.
“New Zealand’s housing market is extremely buoyant at the moment, with more than 8,800 properties sold around the country – that’s more than 283 properties sold every day in October. The last time we saw sales volumes of this magnitude was back in May 2016 when the market was very strong, and prices were rising across many parts of the country.
“Again, we’ve seen more than half (9 out of 16) of the regions across the country with annual sales volume increases in excess of 20% in October – this is just not what anyone expected to happen and shows just how much people’s concern around future price rises is adding to their determination to buy now before prices potentially rise even further,” continues Norwell.
“For two months in a row now, Auckland sales have been up more than 50% when compared to the same time last year, highlighting just how busy the market is right now. With a 36.8% uplift in new listings across Auckland in October, there’s a chance that November could be even busier for the City of Sails,” continues Norwell.
Days to sell lowest for an October month in 17 years
In October, the median number of days to sell a property nationally decreased 5 days from 34 to 29 when compared to October 2019, the lowest for the month of October in 17 years.
For New Zealand excluding Auckland, the median days to sell decreased by 3 days from 32 to 29, the lowest for the month of October in 17 years.
Auckland saw the median number of days to sell a property decrease by 6 days from 36 to 30 year-on-year, the lowest for 51 months.
Taranaki had the lowest days to sell of all regions at 21 days – down 5 days from the same time last year and down 3 days from September. This was the lowest days to sell for Taranaki for an October month since records began.
Manawatu/Wanganui and Marlborough had the second lowest median days to sell in October at 24 days each.
Northland had the highest days to sell for the country at 39 days, down 21 days on last year’s figure, and the lowest days to sell for an October month in 13 years.
“This is the first time since records began that we haven’t had a single region with a median number of days to sell a property over 40 days showing how quickly people are moving to secure a property they like in the current market. As important as it is to be ready to move quickly, it’s important that people take time to do their homework before rushing in to purchase a property,” cautions Norwell.

Inventory levels down YOY but up MOM for first time in 5 months
The total number of properties available for sale nationally decreased by -18.7% in October to 18,141 down from 22,313 in October 2019 – a decrease of 4,172 properties compared to 12 months ago. Additionally, 5 regions (Bay of Plenty, Marlborough, Northland, Southland and Waikato) had their lowest levels of inventory ever.
Regions with the largest percentage decrease in total inventory levels were:
- Taranaki: -47.3% from 531 to 280 – 251 fewer properties
- Marlborough: -40.5% from 269 to 160 – 109 fewer properties
- Northland: -35.9% from 1,338 to 857 – 481 fewer properties.
Manawatu/Wanganui and Wellington had the lowest number of weeks’ inventory with only six weeks inventory available to prospective purchasers, down two weeks and flat respectively when compared to last year’s figure. In third equal place of lowest inventory levels was Bay of Plenty and Nelson with 7 weeks’ inventory available down 8 and 4 weeks’ respectively.
West Coast had the highest number of week’s inventory with 30 weeks’ inventory available to prospective purchasers down from 40 weeks at the same time last year. Northland was the next highest with 26 weeks’ inventory available, down from 36 weeks last year.
However, there is some relief in sight as inventory levels have lifted since last month (+3.2%) the first lift we’ve seen a lift in inventory levels in 5 months.
“This coming summer is looking stronger than we thought possible just eight months ago, but the quantum of success relies on Kiwis being prepared to sell their properties, as listings remain at an absolute premium,” adds Century 21 New Zealand Owner, Derryn Mayne.
“This summer will be a great time to market your house with limited competing listings, but very strong buyer demand resulting in more and faster sales. Mortgage rates keep hitting rock bottom and the economy is doing better than was earlier expected.
“However, 2021 is proving difficult to predict. When you consider the likes of the mortgage holiday scheme ending in March and possibly the return of LVRs also then, if I were contemplating selling, I’d be listing now – in a rising, hungry market,” says Mayne.
The Century 21 New Zealand boss says two things are making a big difference for many vendors currently selling property: Putting a price on it; and online presentation.
“First-home buyers are telling us they won’t go near properties without a price. They have a budget and are tired of going into multi-offer situations and being blown out of the water. Not advertising an asking price can of course benefit a vendor, but they also run the risk of putting off many potential buyers who think it’s just too hard or beyond them,” she says.
In the age of lockdowns, limited travel, and people buying sight unseen, Derryn Mayne says, never before has a property’s online presentation been more important.
“Staging an empty house can add tens of thousands of dollars, especially if buyers are making their determinations via their computer. Professional photography is also critical including the likes of virtual tours, video, and drone footage. 3D floor plans also bring a property to life.”
She says the latest REINZ statistics reinforce that this summer is an opportune time for vendors to sell, and invest in their sale, with professional online presentations returning sellers huge dividends.
“Those Kiwis prepared to list their property this summer, and make a really good job of it, won’t regret their decision. Global uncertainty remains, but clearly not for New Zealand’s real estate market this summer,” says Mayne.
REINZ House Price Index (HPI) reaches another new high
The REINZ House Price Index for New Zealand, which measures the changing value of property in the market, increased 13.5% year-on-year to 3,248 a new high on the index. The increase in the REINZ HPI further demonstrates that intense competition for properties due to the lack of supply is putting pressure on prices.
The HPI for New Zealand excluding Auckland showed house price values increased 12.0% from October 2019 to 3,203 a new high.
Auckland’s house price values increased 15.4% year-on-year to 3,304 also a new high on the index and the largest percentage increase we’ve seen for the region in 53 months (May 2016).
In October, Gisborne/Hawke’s Bay again had the highest annual growth rate in house prices values with a 17.1% increase to a new record index level of 3,488. Again, in second place was Wellington with an annual growth rate of 16.7% to a new record index level of 3,331 and in third place was Auckland with a 15.4% annual increase in house price values – the first time Auckland has made the top 3 list in 59 months (November 2015).
For two months in a row now, the REINZ HPI has shown no negative movements in any region’s house price value, showing the underlying strength in all parts of the country.
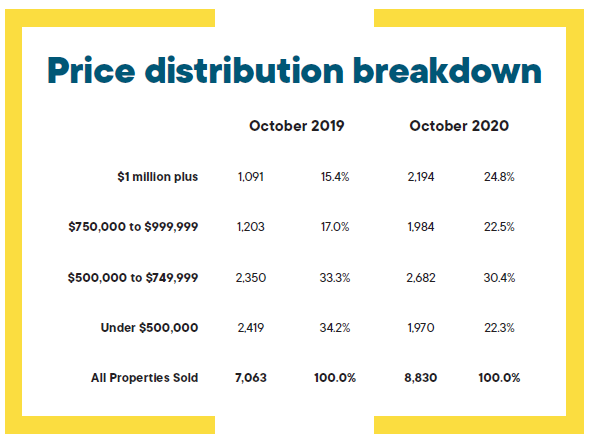
Price Bands
The number of homes sold for less than $500,000 across New Zealand fell from 34.2% of the market (2,419 properties) in October 2019 to 22.3% of the market (1,970 properties) in October 2020.
The number of properties sold in the $500,000 to $750,000 bracket fell from 33.3% (2,350 properties) to 30.4% (2,682 properties).
At the top end of the market, the percentage of properties sold for $1 million or more increased from 15.4% (1,091 properties) in October 2019 to 24.8% (2,194 properties) in October 2020 the highest percentage since records began.