
Four regions hit new record high median sale prices in July, with the national median sale price rising by $5,000 to $505,000, only $1,000 shy of the record median price reached in May 2016, according to the latest data from the Real Estate Institute of New Zealand (REINZ).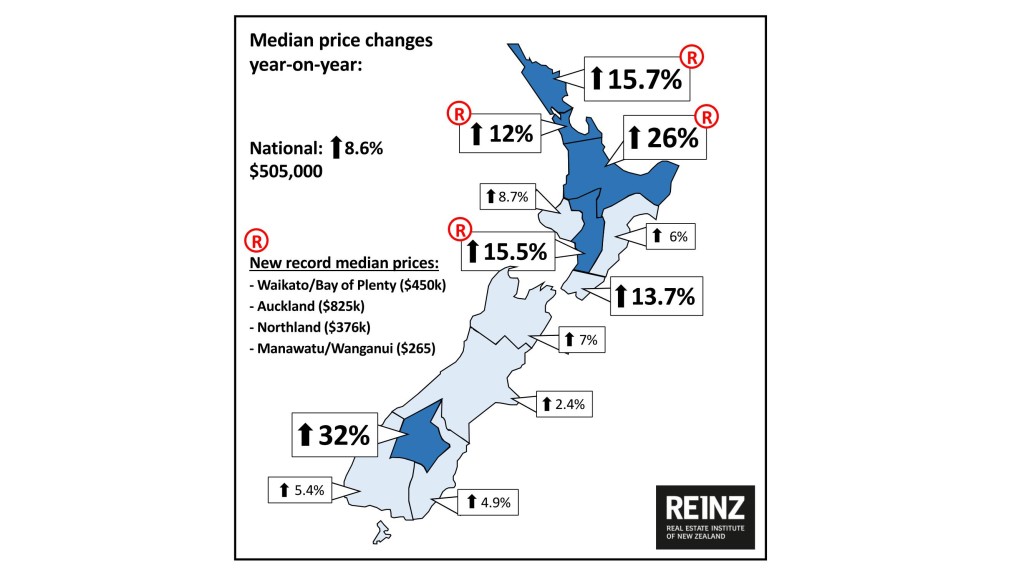
The Waikato/Bay of Plenty region recorded its eighth record median sale price in nine months, reaching $450,000 (up 2.7% on June 2016), while the median price in Auckland reached $825,000 (up 0.5% on June 2016), Northland reached $376,000 (up 4.4% on June 2016) and Manawatu/Wanganui reached $265,000 (up 6.4% on June 2016).
Inventory continues to fall rapidly nationwide, with a 33% decline in properties available for sale year-on-year and six regions seeing falls of greater than 40%. Wellington and Hawke’s Bay each have less than 10 weeks of supply available, with Waikato/Bay of Plenty at just on 10 weeks’ supply.
At the same time, the number of residential dwelling sales for July 2016 was 7,299, a drop of 7% on June. Sales volumes also fell 10% compared to July 2015, with sales for Auckland falling just over 20% compared to July last year.
KEY DATA SUMMARY:
| National median house price year-on-year | National
National ex Auckland |
$505,000 – up from $465,000 (+8.6%) year-on-year
$390,000 – up from $352,000 (+10.8%) year-on-year |
| Auckland median price | $825,000 – up from $735,000 (+12.2%) year-on-year | |
| Seasonally adjusted median house price | National
Auckland |
Up 2% on June 2016 (and +8% year-on-year)
Up 1% on June 2016 (and +12% year-on-year) |
| Month-on-month median house price | National
National ex-Auckland Auckland |
$505,000 – up 1% on June 2016 ($500,000)
$390,000 – up 1% on June 2016 ($385,500) $825,000 – up 0.5% on June 2016 ($821,000) |
| Median days to sell | National
Auckland |
30 – down 2 days year-on-year
30 – up 1 day year-on-year |
Real Estate Institute of New Zealand (REINZ) spokesperson Bryan Thomson says prices continue to rise in many regions, showing that demand is still firm. “Sales volumes remain below previous periods, as the continued shortage of supply impacts buyers, who are struggling to find properties to buy. We will watch market reaction with interest as the expected increase in listing numbers during the spring and summer selling period become available and the market assesses the impact of the recently announced LVR rule changes, the approval or otherwise of the Auckland Unitary Plan and possible interest rate cut.”
“We understand that it must get very confusing for people with so much data available on the real estate market. The key thing is to watch the trends over time, and particularly the seasonally adjusted numbers, as they take month-by-month changes out of the equation and focus on how the market is really moving.”
Median prices jump, led by the regions
The national median house price rose $40,000 (+9%) to $505,000 from July 2015 to July 2016. Compared to June, the national median house price rose $5,000 (+1%). Central Otago Lakes recorded the largest percentage increase in median price compared to July 2015, at 32%, followed by Waikato/Bay of Plenty at 26% and Northland at 16%.
Auckland prices up, volumes come off, inventory stays tight
Compared to July 2015 the median price across the Auckland region rose by $90,000 (+12%) to a new record high of $825,000. The median price rose from June by $4,000 (+0.5%). On a seasonally adjusted basis Auckland’s median price rose 1.0% compared to June.
Although sales volumes in the Auckland region fell 8% compared to June, and fell 20% compared to July 2015, on a seasonally adjusted basis the volume of sales in the Auckland region fell 4% compared to June.
This takes into account low levels of available inventory across the Auckland region, which have increased slightly, but are still at historic lows of below 10 weeks supply.
Auction sales up in the regions year-on-year, down in Auckland
Against a backdrop of reduced nationwide property listings, 1,674 dwellings were sold by auction nationally in July, representing 23% of all sales, a decrease of 221 (-12%) on the number of auctions in July 2015.
Transactions in Auckland represented 61% of national auction sales, down from 74% in July 2015. The number of auctions in Waikato/Bay of Plenty has increased by 46% compared to July 2015, while the number of auctions has increased by 97% in Wellington, albeit off a small base, and by 69% across the rest of New Zealand excluding Auckland.
Thomson says these numbers take into account the lower stock levels in Auckland and the market increase outside of Auckland. “We could have the same number of auctions in Auckland as last year and the contribution to the NZ total would still have reduced due to the increase outside of Auckland.”
Pressure on stock grows, inventory and days to sell falls
The number of properties available for sale across all regions in New Zealand has continued to fall between July 2015 and July 2016. Wellington has the fewest properties for sale with just under six weeks of supply, closely followed by Hawke’s Bay with nine weeks’ supply and Auckland and Waikato/Bay of Plenty with 10 weeks.
The number of days to sell has only improved by two days at the national level over the past 12 months, although the regions have seen some significant improvements with seven regions seeing a decrease of 20% or more in the number of days to sell. Auckland and Canterbury/Westland were the only regions to see a lengthening of the number of days to sell over the past 12 months.
Million dollar homes show largest increase in volumes
Reflecting nationwide price increases, the number of homes sold for more than $1m between July 2015 and July 2016 increased by 12% to 1,015 homes. Equally, the proportion of sales of homes under $600,000 has declined from 65% to 60% (a drop of 5%). The proportion of sales of homes under $400,000 declined by 4% year-on-year.
Image Copyright: <a href=’http://www.123rf.com/profile_jamiefarrant’>jamiefarrant / 123RF Stock Photo</a>


