
House prices across New Zealand have continued to rise in July with a 6.2% increase year-on-year with a median price for the country of $550,000 according to the latest data from the Real Estate Institute of New Zealand (REINZ)
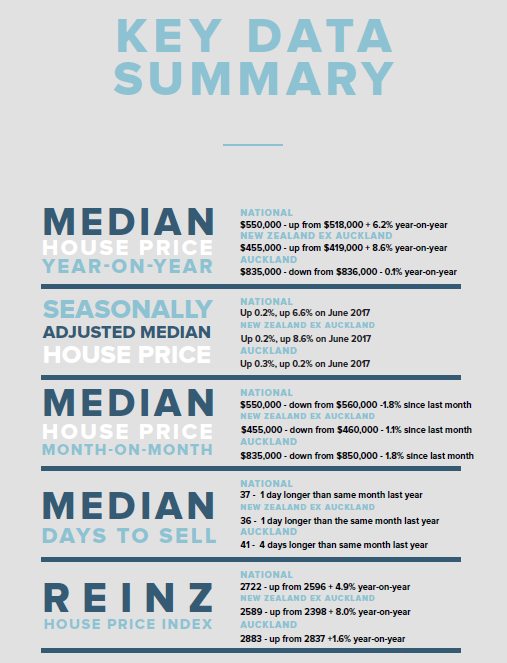 For New Zealand excluding Auckland, the increase was even greater with an 8.6% annual increase from $419,000 to $455,000. In Auckland, prices fell -0.1% year-on-year to $835,000 (down from $836,000).
Four regions saw record prices during July:
- Northland (+5.7% to $481,000)
- Taranaki (+15.4% to $375,000)
- Nelson (+15.2% to $547,000), and
- Marlborough (+13.4% to $453,500) – the second record month in a row.
Bindi Norwell, Chief Executive at REINZ says the shortage of properties available for sale across the country is continuing to push prices up in all regions across the country except for Auckland.
“With July producing another four regions with record median prices we desperately need to increase the supply of new houses – be that through KiwiBuild or from private developers and builders – in order to fill the significant shortage of properties around the country.”
Auckland continues on its steady trajectory with only minor changes in median price each month.
Delving into the Auckland region in greater detail highlights that Auckland and North Shore cities saw median price decreases of -1.6% and -1.3% respectively to $892,000 and $985,000.
“However, Waitakere City saw a median increase of 4.6% to $774,000 highlighting the popularity of this more affordable part of Auckland,” she continues.
“The stability of Auckland’s median price will be welcome news for first-time buyers struggling with Auckland’s house prices, but time will tell whether the low to mid $800,000 mark is a longer-term trend.”
Volumes hold up
The number of houses sold in New Zealand during July increased by 0.7% or an additional 42 properties when compared to the same time last year (from 5,619 to 5,661).
For New Zealand excluding Auckland the number of properties sold increased by a marginal 0.2% or just an additional seven properties when compared to July 2017 (from 3,942 to 3,949).
In Auckland, the number of properties sold increased by 2.1% or an additional 35 properties, from 1,677 in July 2017 to 1,712 in July 2018.
Regions with the biggest annual increase in sales volumes were:
- Southland: +30.6%
- Tasman: +28.0%
- Hawke’s Bay: +8.8%
Regions with the largest annual decrease in sales volumes were:
- Nelson: -19.2% the lowest in 16 months (since January 2017)
- Gisborne: -14.5% the lowest in 5 months
- Marlborough: -12.2% the lowest in 5 months.
July has been a quiet month for the real estate industry with many regions experiencing the lowest sales volumes since January this year.
“Even though it’s the middle of winter volumes have held up when compared to the same time last year – albeit just,” says Norwell.
REINZ House Price Index (HPI)
The REINZ House Price Index for New Zealand, which measures the changing value of property in the market, increased 4.9% year-on-year to 2,722 a new record high for the country.
The HPI for New Zealand excluding Auckland increased 8.0% from July 2017 to a new record high of 2,589.
The Auckland HPI increased 1.6% year-on-year to 2,883 – the same level as June 2018 – showing that despite the annual decrease in median price the market is still in a strong position.
The REINZ HPI saw all 12 regions experience an increase in their HPI over the past 12 months, highlighting the continued strength of the property market. This is the first time in 4 months all 12 regions have seen an increase.
This month the Gisborne/Hawke’s Bay region had the highest annual growth rate of 14.6%, followed by Southland in second place with an annual growth rate of 13.1% and Manawatu-Wanganui in third place with a 12.3% annual increase.
Days to sell
The median number of days to sell a property nationally increased by 1 day from 36 days in July 2017 to 37 days in July 2018.
For New Zealand excluding Auckland, the median days to sell increased by 1 day from 35 to 36.
Auckland saw the median number of days to sell a property increase by 4 days to 41 days (up from 37 in July 2017), and up 1 day from June 2018.
Regions with the biggest decrease in the median number of days to sell were West Coast (-44 from 107 to 63), Taranaki (-5 from 37 to 32) and Gisborne (-4 days from 42 to 38).
Regions with the biggest increase in the median number of days to sell were Nelson (+11 from 24 to 35), Tasman (+6 from 31 to 37) and Waikato (+4 from 39 to 43).
Auctions
Auctions were used in 11.5% of all sales across the country in July, with 649 properties selling under the hammer – this is down slightly from July 2017, when 13.5% of properties (760) were sold via auction.
For the sixth month in a row, Gisborne had the highest percentage of auctions across the country with 38% (or 18 properties) in the region sold under the hammer – down from 31% (17 properties) in July 2017.
Auckland saw the second largest percentage of auctions on 21% (357 properties) down from 24% in July 2017 (408 properties) and the Bay of Plenty on 14% (55 properties) down from 19% (73 properties) in July 2017.
Inventory
The number of properties available for sale nationally decreased by 3.8% from 22,123 to 21,288 – a decrease of 835 properties compared to 12 months ago.
This is the lowest level of inventory for 12 months (since July 2017).
Again, only three regions across New Zealand saw annual increases in inventory levels – Nelson (+25.9% from 280 to 352- an additional 72 properties), Waikato (+11.0% from 1,467 to 1,628 – an additional 161 properties) and Canterbury (+7.7% from 3,050 to 3,284 – an additional 234 properties).
Auckland’s annual inventory decreased by 2.6% (from 8,019 to 7,810 – 209 fewer properties) – the lowest level of inventory for 10 months.
Regions with the biggest falls in inventory were:
- Southland – down 25.3%
- Manawatu/Wanganui – down 24.3%
- Hawke’s Bay – down 16.0%.
For the first time in 5 months Wellington no longer has the lowest level of inventory across the whole country.
Instead, the Hawke’s Bay region now has the lowest level on inventory with only 6.0 weeks’ inventory – down 25.4% year-on-year.
Wellington was a close second with only 7 weeks’ inventory, although this is up 8.8% on July 2017.
The Manawatu/Wanganui region still only has 9 weeks’ inventory available to prospective purchasers.
Price Bands
The number of homes sold for less than $500,000 across New Zealand fell from 47.8% of the market (2,687 properties) in July 2017 to 42.4% of the market (2,402 properties) in July 2018 which is reflected by the overall increasing median price across the country.
The number of properties sold in the $500,000 to $750,000 bracket increased from 27.0% in July 2017 (1,516 properties) to 30.3% in July 2018 (1,715 properties).
At the top end of the market, properties sold for more than $1 million remained exactly the same from a percentage perspective with 13.0% (729 million-dollar plus properties were sold in July 2017 compared to 737 in July 2018).
“For first-time buyers looking for the most affordable place in New Zealand to buy, they could focus on the West Coast as 55.6% of all properties there are below the $250,000 mark,” Norwell suggests.
The next most affordable regions were Southland and Manawatu/Wanganui with 50.0% and 37.1% of properties respectively below the $250,000 mark.
“The only region in New Zealand with no properties available below the $250,000 threshold was Nelson – even Auckland had 1.05% of properties available below $250,000 in July,” concludes Norwell.


